

Question: I need all the excel formulas shown for numbers #1-3. This is the second try for the correct answers. Enter a SUMIFS function into cell
I need all the excel formulas shown for numbers #1-3.
This is the second try for the correct answers.
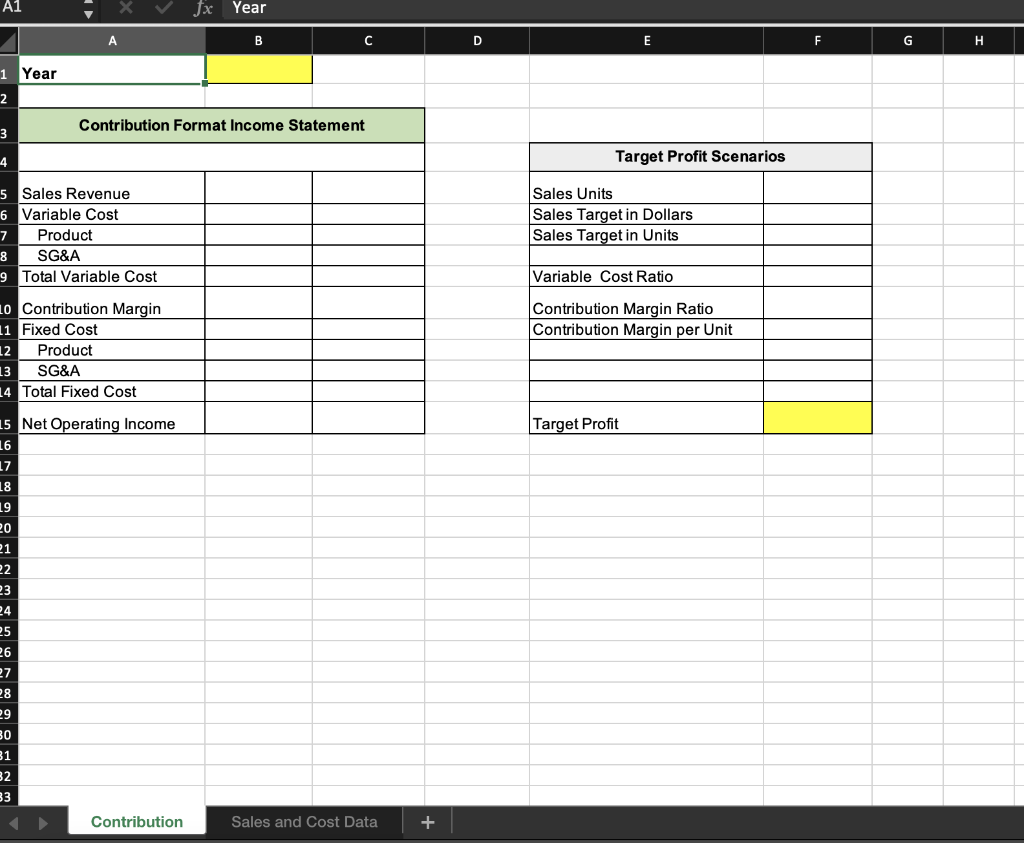
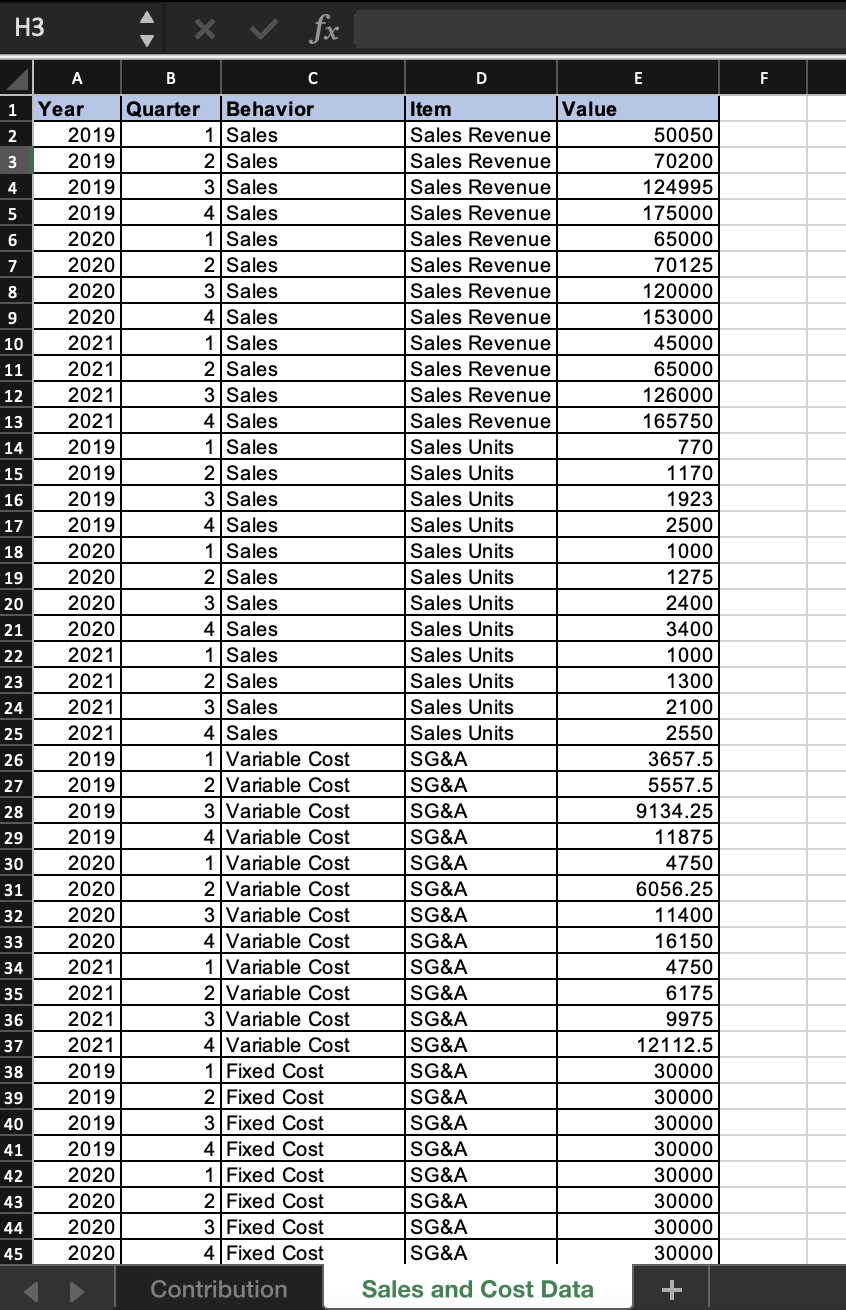
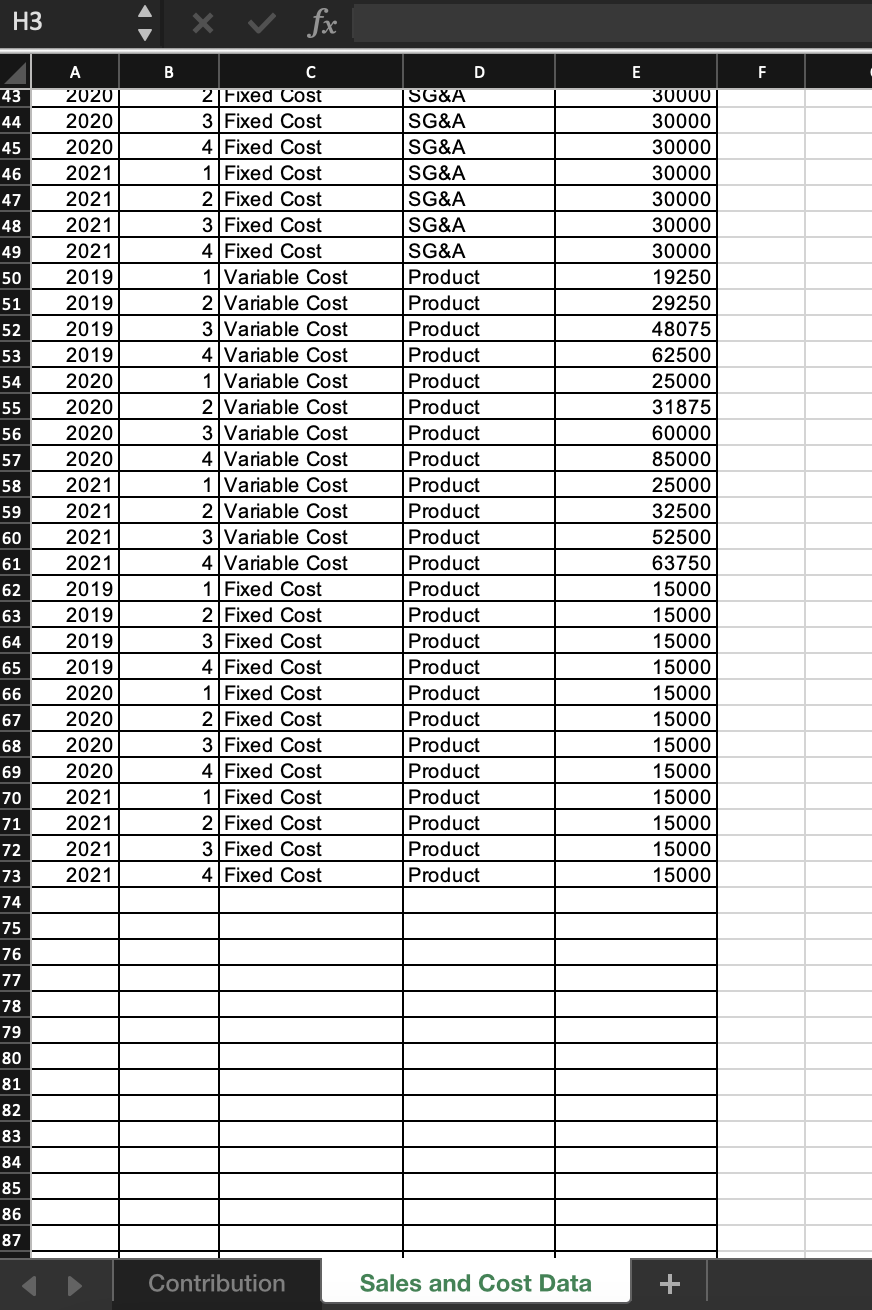
- Enter a SUMIFS function into cell B7 on the Contribution worksheet that sums the variable product costs on the Sales and Cost Data worksheet. The setup of this function is identical to the SUMIFS function in step 3 with the following changes: This function should find a match to the item in cell A6 (Variable Cost) in Column C on the Sales and Cost Data worksheet. This function should also find a match to the item in cell A7 (Product) in Column D on the Sales and Cost Data worksheet. Add cell capacity to include Row 100 on the Sales and Cost Data worksheet.
- Enter a SUMIFS function into cell B8 on the Contribution worksheet that sums the variable SG&A costs on the Sales and Cost Data worksheet. The setup of this function is identical to the SUMIFS function in step 4 except this function should find a match to the item in cell A8 (SG&A) in Column D on the Sales and Cost Data worksheet. Add cell capacity to include Row 100 on the Sales and Cost Data worksheet.
- Enter a formula in cell C9 on the Contribution worksheet that sums the two variable costs in cells B7 and B8.
A1 fx Year B D E F H 1 Year 2 Contribution Format Income Statement 3 4 Target Profit Scenarios 5 Sales Revenue 6 Variable Cost 7 Product 8 SG&A 9 Total Variable Cost Sales Units Sales Target in Dollars Sales Target in Units Variable Cost Ratio Contribution Margin Ratio Contribution Margin per Unit 10 Contribution Margin 11 Fixed Cost 12 Product 13 SG&A 14 Total Fixed Cost Target Profit 15 Net Operating Income 16 17 18 19 20 21 22 23 24 25 26 27 28 29 30 31 32 33 Contribution Sales and Cost Data + H3 fx E F A B C D 1 Year Quarter Behavior Item Value 2 2019 1 Sales Sales Revenue 3 2019 2 Sales Sales Revenue 4 2019 3 Sales Sales Revenue 5 2019 4 Sales Sales Revenue 6 2020 1 Sales Sales Revenue 7 2020 2 Sales Sales Revenue 8 2020 3 Sales Sales Revenue 9 2020 4 Sales Sales Revenue 10 2021 1 Sales Sales Revenue 11 2021 2 Sales Sales Revenue 12 2021 3 Sales Sales Revenue 13 2021 4 Sales Sales Revenue 14 2019 1 Sales Sales Units 15 2019 2 Sales Sales Units 16 2019 3 Sales Sales Units 17 2019 4 Sales Sales Units 18 2020 1 Sales Sales Units 19 2020 2 Sales Sales Units 20 2020 3 Sales Sales Units 21 2020 4 Sales Sales Units 22 2021 1 Sales Sales Units 23 2021 2 Sales Sales Units 24 2021 3 Sales Sales Units 25 2021 4 Sales Sales Units 26 2019 1 Variable Cost SG&A 27 2019 2 Variable Cost SG&A 28 2019 3 Variable Cost SG&A 29 2019 4 Variable Cost SG&A 30 2020 1 Variable Cost SG&A 31 2020 2 Variable Cost SG&A 32 2020 3 Variable Cost SG&A 33 2020 4 Variable Cost SG&A 34 2021 1 Variable Cost SG&A 35 2021 2 Variable Cost SG&A 36 2021 3 Variable Cost SG&A 37 2021 4 Variable Cost SG&A 38 2019 1 Fixed Cost SG&A 39 2019 2 Fixed Cost SG&A 40 2019 3 Fixed Cost SG&A 41 2019 4 Fixed Cost SG&A 42 2020 1 Fixed Cost SG&A 43 2020 2 Fixed Cost SG&A 44 2020 3 Fixed Cost SG&A 45 2020 4 Fixed Cost SG&A Contribution Sales and Cost Data 50050 70200 124995 175000 65000 70125 120000 153000 45000 65000 126000 165750 770 1170 1923 2500 1000 1275 2400 3400 1000 1300 2100 2550 3657.5 5557.5 9134.25 11875 4750 6056.25 11400 16150 4750 6175 9975 12112.5 30000 30000 30000 30000 30000 30000 30000 30000 + H3 fx B D F 43 44 45 46 47 48 49 50 51 52 53 54 55 56 57 A 2020 2020 2020 2021 2021 2021 2021 2019 2019 2019 2019 2020 2020 2020 2020 2021 2021 2021 2021 2019 2019 2019 2019 2020 2020 2020 2020 2021 2021 2021 2021 C 2 Fixed Cost 3 Fixed Cost 4 Fixed Cost 1 Fixed Cost 2 Fixed Cost 3 Fixed Cost 4 Fixed Cost 1 Variable Cost 2 Variable Cost 3 Variable Cost 4 Variable Cost 1 Variable Cost 2 Variable Cost 3 Variable Cost 4 Variable Cost 1 Variable Cost 2 Variable Cost 3 Variable Cost 4 Variable Cost 1 Fixed Cost 2 Fixed Cost 3 Fixed Cost 4 Fixed Cost 1 Fixed Cost 2 Fixed Cost 3 Fixed Cost 4 Fixed Cost 1 Fixed Cost 2 Fixed Cost 3 Fixed Cost 4 Fixed Cost E 30000 30000 30000 30000 30000 30000 30000 19250 29250 48075 62500 25000 31875 60000 85000 25000 32500 52500 63750 15000 15000 15000 15000 15000 15000 15000 15000 15000 15000 15000 15000 SG&A SG&A SG&A SG&A SG&A SG&A SG&A Product Product Product Product Product Product Product Product Product Product Product Product Product Product Product Product Product Product Product Product Product Product Product Product 58 59 60 61 62 63 64 65 66 67 68 69 70 71 72 73 74 75 76 77 78 79 80 81 82 83 84 85 86 87 Contribution Sales and Cost Data + A1 fx Year B D E F H 1 Year 2 Contribution Format Income Statement 3 4 Target Profit Scenarios 5 Sales Revenue 6 Variable Cost 7 Product 8 SG&A 9 Total Variable Cost Sales Units Sales Target in Dollars Sales Target in Units Variable Cost Ratio Contribution Margin Ratio Contribution Margin per Unit 10 Contribution Margin 11 Fixed Cost 12 Product 13 SG&A 14 Total Fixed Cost Target Profit 15 Net Operating Income 16 17 18 19 20 21 22 23 24 25 26 27 28 29 30 31 32 33 Contribution Sales and Cost Data + H3 fx E F A B C D 1 Year Quarter Behavior Item Value 2 2019 1 Sales Sales Revenue 3 2019 2 Sales Sales Revenue 4 2019 3 Sales Sales Revenue 5 2019 4 Sales Sales Revenue 6 2020 1 Sales Sales Revenue 7 2020 2 Sales Sales Revenue 8 2020 3 Sales Sales Revenue 9 2020 4 Sales Sales Revenue 10 2021 1 Sales Sales Revenue 11 2021 2 Sales Sales Revenue 12 2021 3 Sales Sales Revenue 13 2021 4 Sales Sales Revenue 14 2019 1 Sales Sales Units 15 2019 2 Sales Sales Units 16 2019 3 Sales Sales Units 17 2019 4 Sales Sales Units 18 2020 1 Sales Sales Units 19 2020 2 Sales Sales Units 20 2020 3 Sales Sales Units 21 2020 4 Sales Sales Units 22 2021 1 Sales Sales Units 23 2021 2 Sales Sales Units 24 2021 3 Sales Sales Units 25 2021 4 Sales Sales Units 26 2019 1 Variable Cost SG&A 27 2019 2 Variable Cost SG&A 28 2019 3 Variable Cost SG&A 29 2019 4 Variable Cost SG&A 30 2020 1 Variable Cost SG&A 31 2020 2 Variable Cost SG&A 32 2020 3 Variable Cost SG&A 33 2020 4 Variable Cost SG&A 34 2021 1 Variable Cost SG&A 35 2021 2 Variable Cost SG&A 36 2021 3 Variable Cost SG&A 37 2021 4 Variable Cost SG&A 38 2019 1 Fixed Cost SG&A 39 2019 2 Fixed Cost SG&A 40 2019 3 Fixed Cost SG&A 41 2019 4 Fixed Cost SG&A 42 2020 1 Fixed Cost SG&A 43 2020 2 Fixed Cost SG&A 44 2020 3 Fixed Cost SG&A 45 2020 4 Fixed Cost SG&A Contribution Sales and Cost Data 50050 70200 124995 175000 65000 70125 120000 153000 45000 65000 126000 165750 770 1170 1923 2500 1000 1275 2400 3400 1000 1300 2100 2550 3657.5 5557.5 9134.25 11875 4750 6056.25 11400 16150 4750 6175 9975 12112.5 30000 30000 30000 30000 30000 30000 30000 30000 + H3 fx B D F 43 44 45 46 47 48 49 50 51 52 53 54 55 56 57 A 2020 2020 2020 2021 2021 2021 2021 2019 2019 2019 2019 2020 2020 2020 2020 2021 2021 2021 2021 2019 2019 2019 2019 2020 2020 2020 2020 2021 2021 2021 2021 C 2 Fixed Cost 3 Fixed Cost 4 Fixed Cost 1 Fixed Cost 2 Fixed Cost 3 Fixed Cost 4 Fixed Cost 1 Variable Cost 2 Variable Cost 3 Variable Cost 4 Variable Cost 1 Variable Cost 2 Variable Cost 3 Variable Cost 4 Variable Cost 1 Variable Cost 2 Variable Cost 3 Variable Cost 4 Variable Cost 1 Fixed Cost 2 Fixed Cost 3 Fixed Cost 4 Fixed Cost 1 Fixed Cost 2 Fixed Cost 3 Fixed Cost 4 Fixed Cost 1 Fixed Cost 2 Fixed Cost 3 Fixed Cost 4 Fixed Cost E 30000 30000 30000 30000 30000 30000 30000 19250 29250 48075 62500 25000 31875 60000 85000 25000 32500 52500 63750 15000 15000 15000 15000 15000 15000 15000 15000 15000 15000 15000 15000 SG&A SG&A SG&A SG&A SG&A SG&A SG&A Product Product Product Product Product Product Product Product Product Product Product Product Product Product Product Product Product Product Product Product Product Product Product Product 58 59 60 61 62 63 64 65 66 67 68 69 70 71 72 73 74 75 76 77 78 79 80 81 82 83 84 85 86 87 Contribution Sales and Cost Data +
Step by Step Solution
There are 3 Steps involved in it

Get step-by-step solutions from verified subject matter experts