

Question: I need an excel graph for this data This all the information you need i have no more information!!!!!! Page 2 of 2 Take Home
 I need an excel graph for this data
This all the information you need
i have no more information!!!!!!
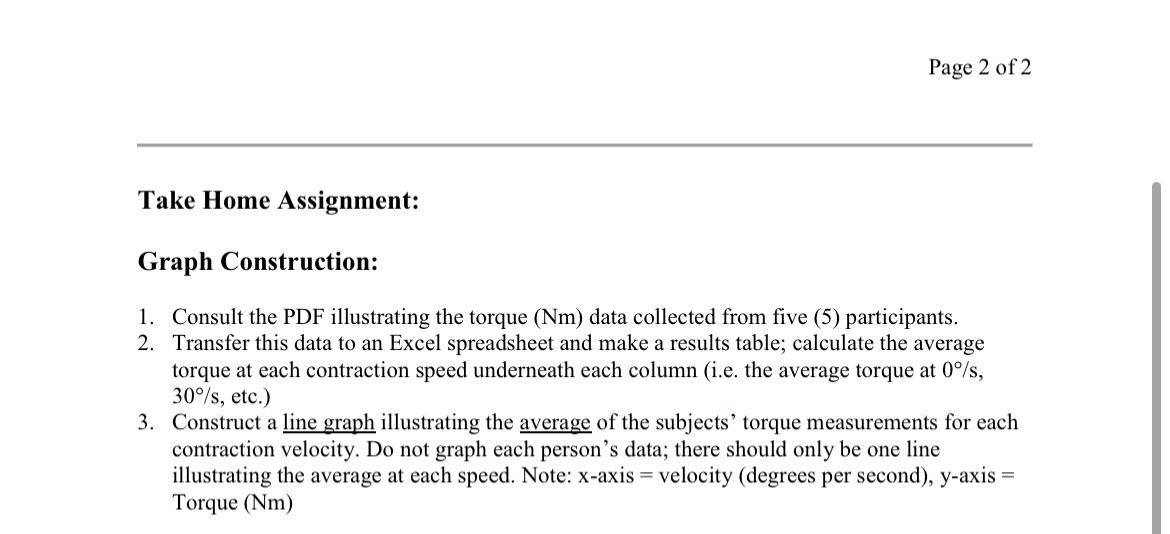
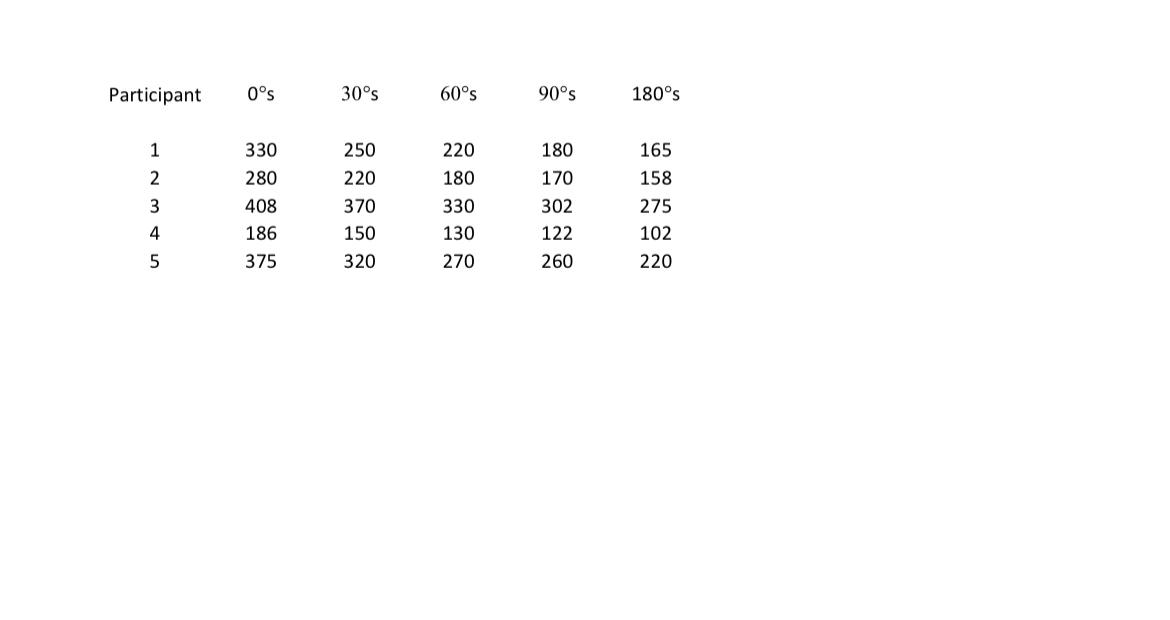
Page 2 of 2 Take Home Assignment: Graph Construction: 1. Consult the PDF illustrating the torque (Nm) data collected from five (5) participants. 2. Transfer this data to an Excel spreadsheet and make a results table; calculate the average torque at each contraction speed underneath each column (i.e. the average torque at 0/s, 30%/s, etc.) 3. Construct a line graph illustrating the average of the subjects' torque measurements for each contraction velocity. Do not graph each person's data; there should only be one line illustrating the average at each speed. Note: x-axis = velocity (degrees per second), y-axis: Torque (Nm) = Participant P 2345 180s
Step by Step Solution
There are 3 Steps involved in it
1 Expert Approved Answer
Step: 1 Unlock

Question Has Been Solved by an Expert!
Get step-by-step solutions from verified subject matter experts
Step: 2 Unlock
Step: 3 Unlock