

Question: I need answer for this question. Give me the answer and details explanation. Please help me. I will give the best rate for you. Thanks
I need answer for this question. Give me the answer and details explanation.
Please help me. I will give the best rate for you. Thanks
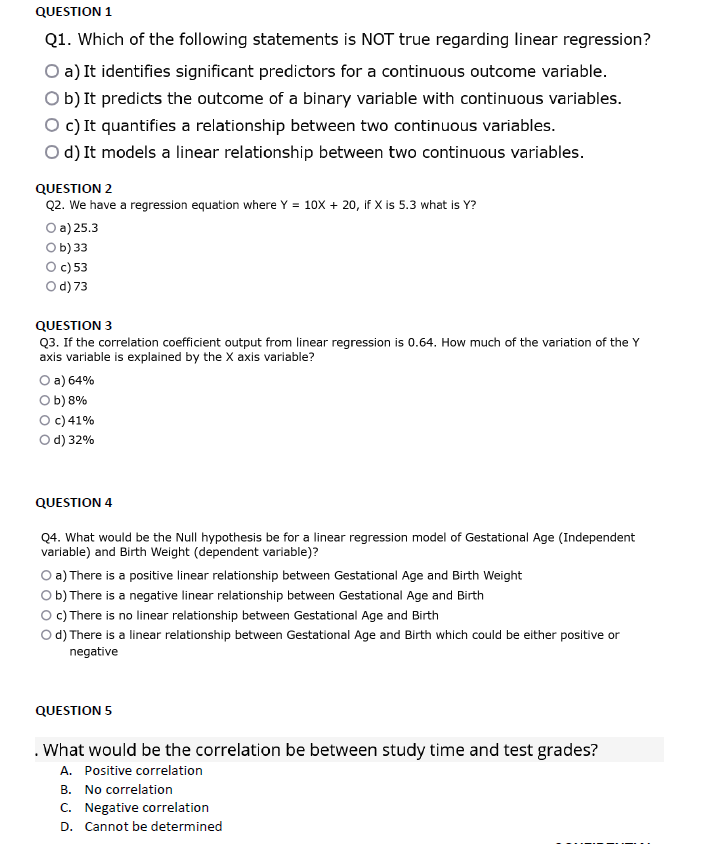
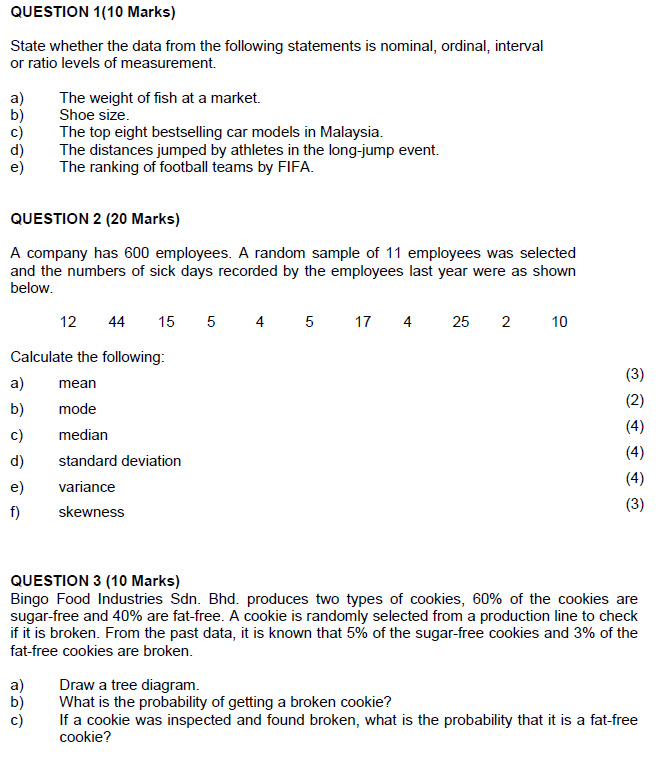
QUESTION 1 Q1. Which of the following statements is NOT true regarding linear regression? O a) It identifies significant predictors for a continuous outcome variable. O b) It predicts the outcome of a binary variable with continuous variables. O c) It quantifies a relationship between two continuous variables. O d) It models a linear relationship between two continuous variables. QUESTION 2 Q2. We have a regression equation where Y = 10X + 20, if X is 5.3 what is Y? O a) 25.3 O b) 33 O c) 53 O d) 73 QUESTION 3 Q3. If the correlation coefficient output from linear regression is 0.64. How much of the variation of the Y axis variable is explained by the X axis variable? O a) 64% O b) 8% O c) 41% O d) 32% QUESTION 4 Q4. What would be the Null hypothesis be for a linear regression model of Gestational Age (Independent variable) and Birth Weight (dependent variable)? O a) There is a positive linear relationship between Gestational Age and Birth Weight O b) There is a negative linear relationship between Gestational Age and Birth O c) There is no linear relationship between Gestational Age and Birth O d) There is a linear relationship between Gestational Age and Birth which could be either positive or negative QUESTION 5 . What would be the correlation be between study time and test grades? A. Positive correlation B. No correlation C. Negative correlation D. Cannot be determinedQUESTION 1(10 Marks) State whether the data from the following statements is nominal, ordinal, interval or ratio levels of measurement. The weight of fish at a market. Shoe size. 06050 The top eight bestselling car models in Malaysia. The distances jumped by athletes in the long-jump event. The ranking of football teams by FIFA. QUESTION 2 (20 Marks) A company has 600 employees. A random sample of 11 employees was selected and the numbers of sick days recorded by the employees last year were as shown below. 12 44 15 5 4 5 17 4 25 2 10 Calculate the following: mean b) mode C) median d) standard deviation variance skewness QUESTION 3 (10 Marks) Bingo Food Industries Sdn. Bhd. produces two types of cookies, 60% of the cookies are sugar-free and 40% are fat-free. A cookie is randomly selected from a production line to check if it is broken. From the past data, it is known that 5% of the sugar-free cookies and 3% of the fat-free cookies are broken. Draw a tree diagram. Q50 What is the probability of getting a broken cookie? If a cookie was inspected and found broken, what is the probability that it is a fat-free cookie
Step by Step Solution
There are 3 Steps involved in it

Get step-by-step solutions from verified subject matter experts