

Question: I need answer please 3. The table below depicts 14 sample means that were taken at periodic intervals and plotted on a control chart. Does
I need answer please
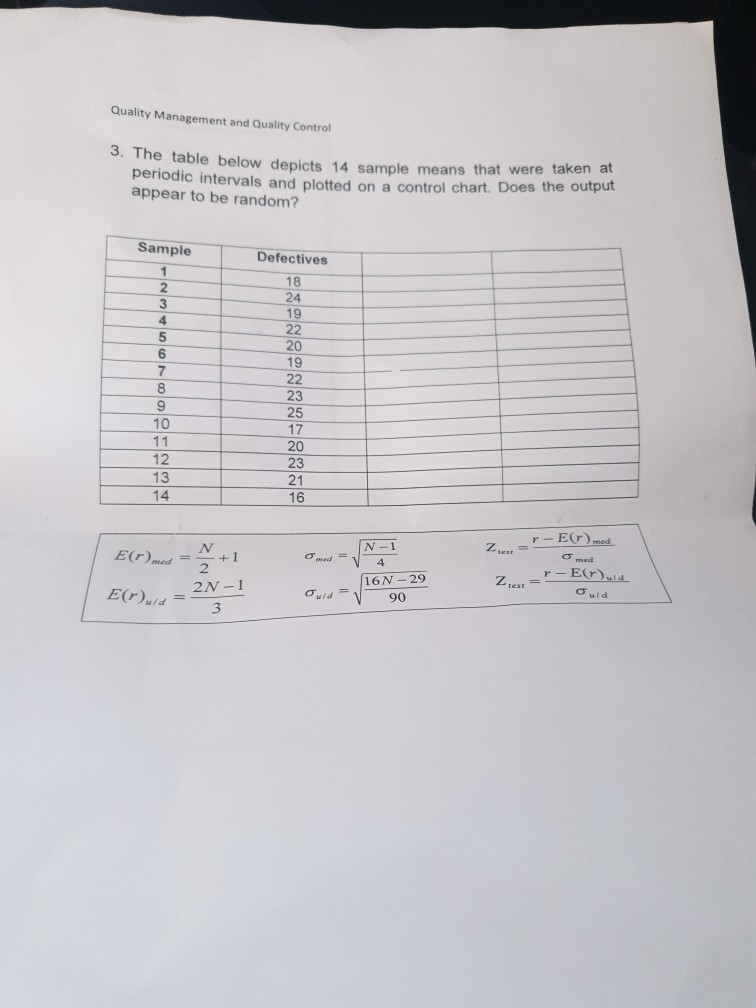
3. The table below depicts 14 sample means that were taken at periodic intervals and plotted on a control chart. Does the output Quality Management and Quality Control appear to be random? Sample 1 2 3 4 5 6. 7 8 9 10 11 12 13 14 Defectives 18 24 19 22 20 10 19 22 23 25 17 20 21 16 E(r) med N +1 2 2N-1 Ers/d = 3 N-1 4 16N - 29 90 r-Ermed Zient = o med Ziest r-ErlaStep by Step Solution
There are 3 Steps involved in it
1 Expert Approved Answer
Step: 1 Unlock

Question Has Been Solved by an Expert!
Get step-by-step solutions from verified subject matter experts
Step: 2 Unlock
Step: 3 Unlock