

Question: I need answer with explain questions 1and 2 1. Interpret (explain) the following graph. Explain why each curve has its particular shape in relation to
I need answer with explain questions 1and 2
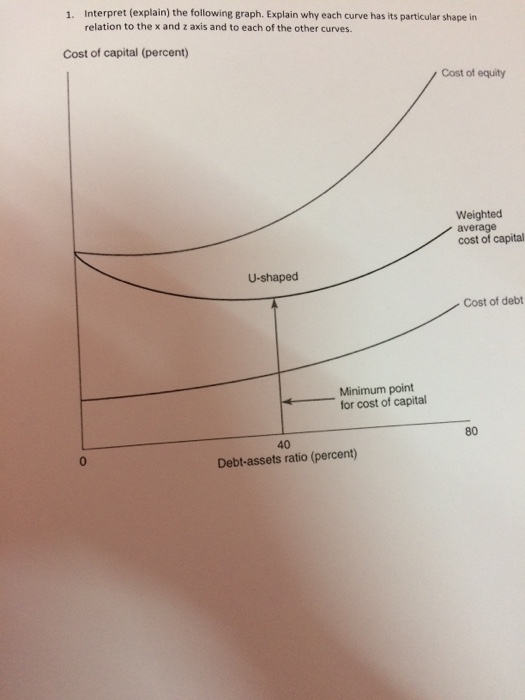
1. Interpret (explain) the following graph. Explain why each curve has its particular shape in relation to the x and z axis and to each of the other curves. cost of capital (percent) Cost of equity Weighted average cost of capital U-shaped Cost of debt Minimum point for cost of capital Debt-assets ratio (percent)
Step by Step Solution
There are 3 Steps involved in it
1 Expert Approved Answer
Step: 1 Unlock

Question Has Been Solved by an Expert!
Get step-by-step solutions from verified subject matter experts
Step: 2 Unlock
Step: 3 Unlock