

Question: Please help in Codio for PYTHON: MATH STEM CALSS Need Help In Codio Python with 1. Part l: Descriptive Statistics (Scenario B) Scenario B: Solar
Please help in Codio for PYTHON: MATH STEM CALSS

 Need Help In Codio Python with
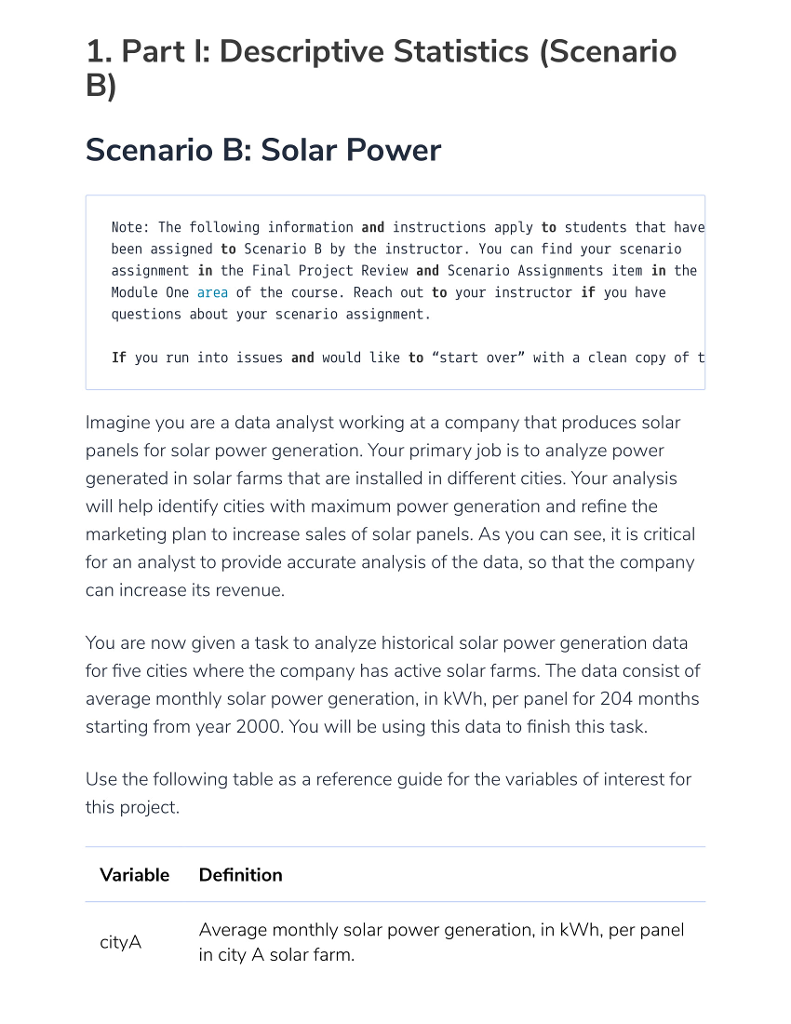
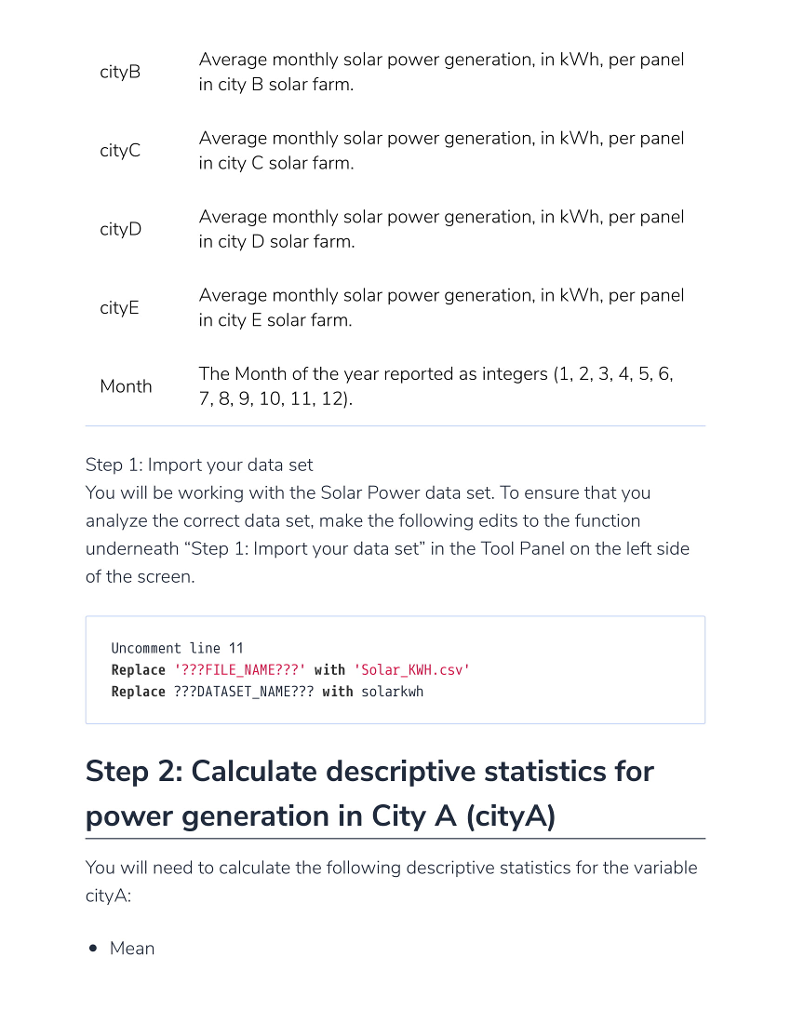
1. Part l: Descriptive Statistics (Scenario B) Scenario B: Solar Power Note: The following information and instructions apply to students that have been assigned to Scenario B by the instructor. You can find your scenario assignment in the Final Project Review and Scenario Assignments item in the Module One area of the course. Reach out to your instructor if you have questions about your scenario assignment. If you run into issues and would like to "start over" with a clean copy of t Imagine you are a data analyst working at a company that produces solar panels for solar power generation. Your primary job is to analyze power generated in solar farms that are installed in different cities. Your analysis will help identify cities with maximum power generation and refine the marketing plan to increase sales of solar panels. As you can see, it is critical for an analyst to provide accurate analysis of the data, so that the company can increase its revenue. You are now given a task to analyze historical solar power generation data for five cities where the company has active solar farms. The data consist of average monthly solar power generation, in kWh, per panel for 204 months starting from year 2000. You will be using this data to finish this task Use the following table as a reference guide for the variables of interest for this project. Variable Definition Average monthly solar power generation, in kWh, per panll in city A solar farm. cityA 1. Part l: Descriptive Statistics (Scenario B) Scenario B: Solar Power Note: The following information and instructions apply to students that have been assigned to Scenario B by the instructor. You can find your scenario assignment in the Final Project Review and Scenario Assignments item in the Module One area of the course. Reach out to your instructor if you have questions about your scenario assignment. If you run into issues and would like to "start over" with a clean copy of t Imagine you are a data analyst working at a company that produces solar panels for solar power generation. Your primary job is to analyze power generated in solar farms that are installed in different cities. Your analysis will help identify cities with maximum power generation and refine the marketing plan to increase sales of solar panels. As you can see, it is critical for an analyst to provide accurate analysis of the data, so that the company can increase its revenue. You are now given a task to analyze historical solar power generation data for five cities where the company has active solar farms. The data consist of average monthly solar power generation, in kWh, per panel for 204 months starting from year 2000. You will be using this data to finish this task Use the following table as a reference guide for the variables of interest for this project. Variable Definition Average monthly solar power generation, in kWh, per panll in city A solar farm. cityA
Step by Step Solution
There are 3 Steps involved in it

Get step-by-step solutions from verified subject matter experts