

Question: i need b-d, g, i, &m please Problem 4-7 Financial Ratios (L03) Here are simplified financial statements for Phone Corporation in a recent year: INCOME
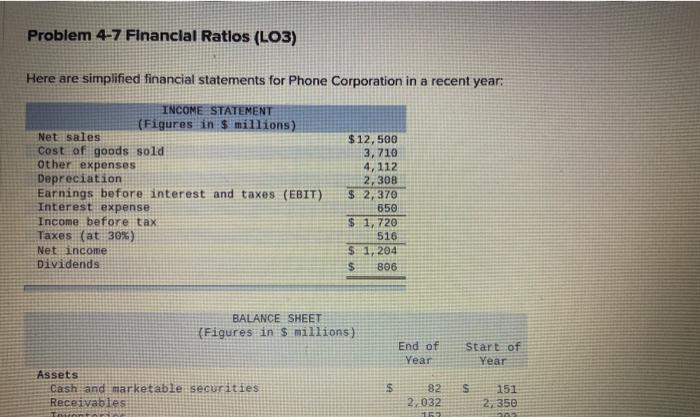
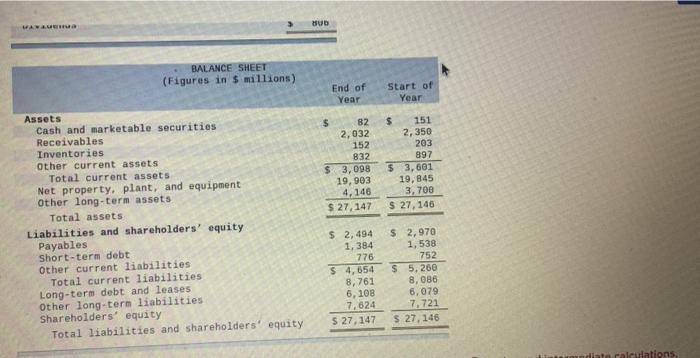
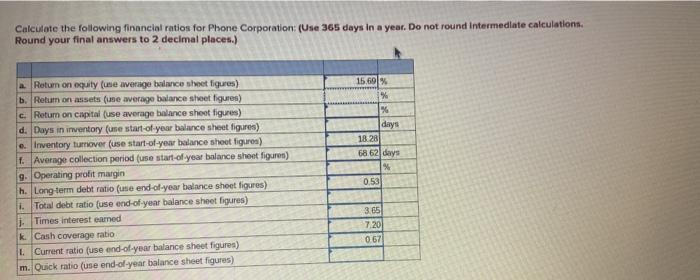
Problem 4-7 Financial Ratios (L03) Here are simplified financial statements for Phone Corporation in a recent year: INCOME STATEMENT (Figures in $ millions) Net sales Cost of goods sold other expenses Depreciation Earnings before interest and taxes (EBIT) Interest expense Income before tax Taxes (at 30%) Net income Dividends $12,500 3, 710 4,112 2,308 $ 2,370 550 $ 1,720 516 S 1,204 $ B06 BALANCE SHEET (Figures in $ millions) End of Year Start of Year Assets Cash and marketable securities Receivables $ S 82 2,032 163 151 2,350 00 BALANCE SHEET (Figures in 5 millions) End of Year Start of Year $ 82 2,032 152 832 $ 3,098 19, 903 4,146 $ 27,147 $ 151 2,350 203 897 $ 3,601 19,845 3,700 $ 27,146 Assets Cash and marketable securities Receivables Inventories Other current assets Total current assets Net property, plant, and equipment other long-term assets Total assets Liabilities and shareholders' equity Payables Short-term debt Other current liabilities Total current liabilities Long-term debt and leases Other long-term liabilities Shareholders' equity Total liabilities and shareholders' equity $ 2,494 1,384 776 $ 4,654 8,761 6, 108 7,624 $ 27,147 $ 2,970 1,538 752 $ 5,260 8,086 6,079 7.721 $ 27,146 mundiata calculations Calculate the following financial ratios for Phone Corporation: (Use 365 days in a year. Do not round Intermediate calculations. Round your final answers to 2 decimal places.) 15,60% % % days Return on equity (une average balance sheet figures) b. Return on assets (use average balance sheet figures) c. Return on capital (use average balance sheet figures) d. Days in inventory (use start of year balance sheet figures) e. Inventory turnover (use start-of-year balance sheet figures) 1. Average collection period (use start of year balance sheet figures) 9. Operating profit margin h. Long term debit ratio (me end-of-year balance sheet figures) 1. Total debt ratio (use end-of-year balance sheet figures) 1. Times interest earned k Cash coverage ratio L. Current ratio (use end-of-year balance sheet figures) m. Quick ratio (use end-of-year balance sheet figures) 18.28 68 62 days % 0.53 3.65 7,20 064
Step by Step Solution
There are 3 Steps involved in it

Get step-by-step solutions from verified subject matter experts