

Question: Only Need Help With E, F, G, H! Problem 4-7 Financial Ratios (L03) Here are simplified financial statements for Phone Corporation in a recent year:
Only Need Help With E, F, G, H!
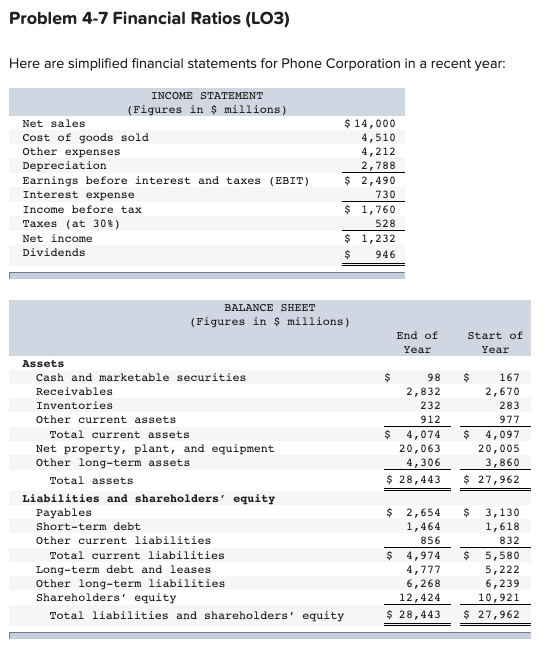
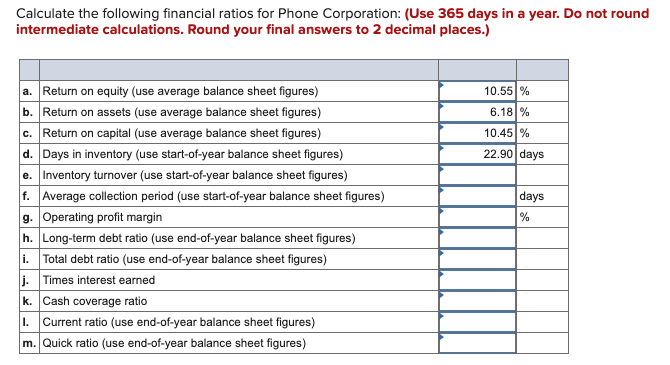
Problem 4-7 Financial Ratios (L03) Here are simplified financial statements for Phone Corporation in a recent year: INCOME STATEMENT (Figures in $ millions) Net sales $ 14,000 Cost of goods sold 4,510 Other expenses 4,212 Depreciation 2,788 Earnings before interest and taxes (EBIT) $ 2,490 Interest expense 730 Income before tax $ 1,760 Taxes (at 30%) 528 Net income $ 1,232 Dividends $ 946 BALANCE SHEET (Figures in $ millions) End of Year Start of Year $ 98 2,832 232 912 $ 4,074 20,063 4,306 $ 28,443 $ 167 2,670 283 977 $ 4,097 20,005 3,860 $ 27,962 Assets Cash and marketable securities Receivables Inventories Other current assets Total current assets Net property, plant, and equipment Other long-term assets Total assets Liabilities and shareholders' equity Payables Short-term debt Other current liabilities Total current liabilities Long-term debt and leases Other long-term liabilities Shareholders' equity Total liabilities and shareholders' equity $ 2,654 1,464 856 $ 4,974 4,777 6,268 12,424 $ 28,443 $ 3,130 1,618 832 $ 5,580 5, 222 6,239 10,921 $ 27,962 Calculate the following financial ratios for Phone Corporation: (Use 365 days in a year. Do not round intermediate calculations. Round your final answers to 2 decimal places.) 10.55% 6.18% 10.45% 22.90 days a. Return on equity (use average balance sheet figures) b. Return on assets (use average balance sheet figures) c. Return on capital (use average balance sheet figures) d. Days in inventory (use start-of-year balance sheet figures) e. Inventory turnover (use start-of-year balance sheet figures) f. Average collection period (use start-of-year balance sheet figures) g. Operating profit margin n. Long-term debt ratio (use end-of-year balance sheet figures) I. Total debt ratio (use end-of-year balance sheet figures) 1. Times interest earned K. Cash coverage ratio 1. Current ratio (use end-of-year balance sheet figures) m. Quick ratio (use end-of-year balance sheet figures) days %
Step by Step Solution
There are 3 Steps involved in it

Get step-by-step solutions from verified subject matter experts