

Question: I need calculated answer not excel one please (11) MSE MA N 5. The following table shows the amount of real sales of a company
I need calculated answer not excel one please
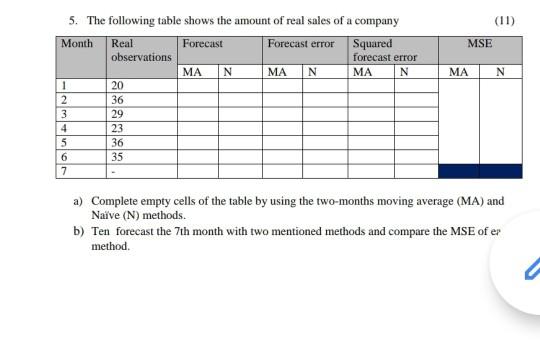
(11) MSE MA N 5. The following table shows the amount of real sales of a company Month Real Forecast Forecast error Squared observations forecast error MA N MA N MA N 1 20 2 36 3 29 4 23 5 36 35 7 6 a) Complete empty cells of the table by using the two-months moving average (MA) and Naive (N) methods. forecast 7th month with two mentioned methods and compare MSE of er methodStep by Step Solution
There are 3 Steps involved in it
1 Expert Approved Answer
Step: 1 Unlock

Question Has Been Solved by an Expert!
Get step-by-step solutions from verified subject matter experts
Step: 2 Unlock
Step: 3 Unlock