

Question: I NEED COMPUTER GENERATED ANSWER AND CHART AND DIAGRAMS!!! NOT HAND WRITTEN PLEASE!!! I WILL GIVE YOU THUMB UPS FR IF YOU FULFILL THE REQUIREMENTS!!!
I NEED COMPUTER GENERATED ANSWER AND CHART AND DIAGRAMS!!! NOT HAND WRITTEN PLEASE!!! I WILL GIVE YOU THUMB UPS FR IF YOU FULFILL THE REQUIREMENTS!!!
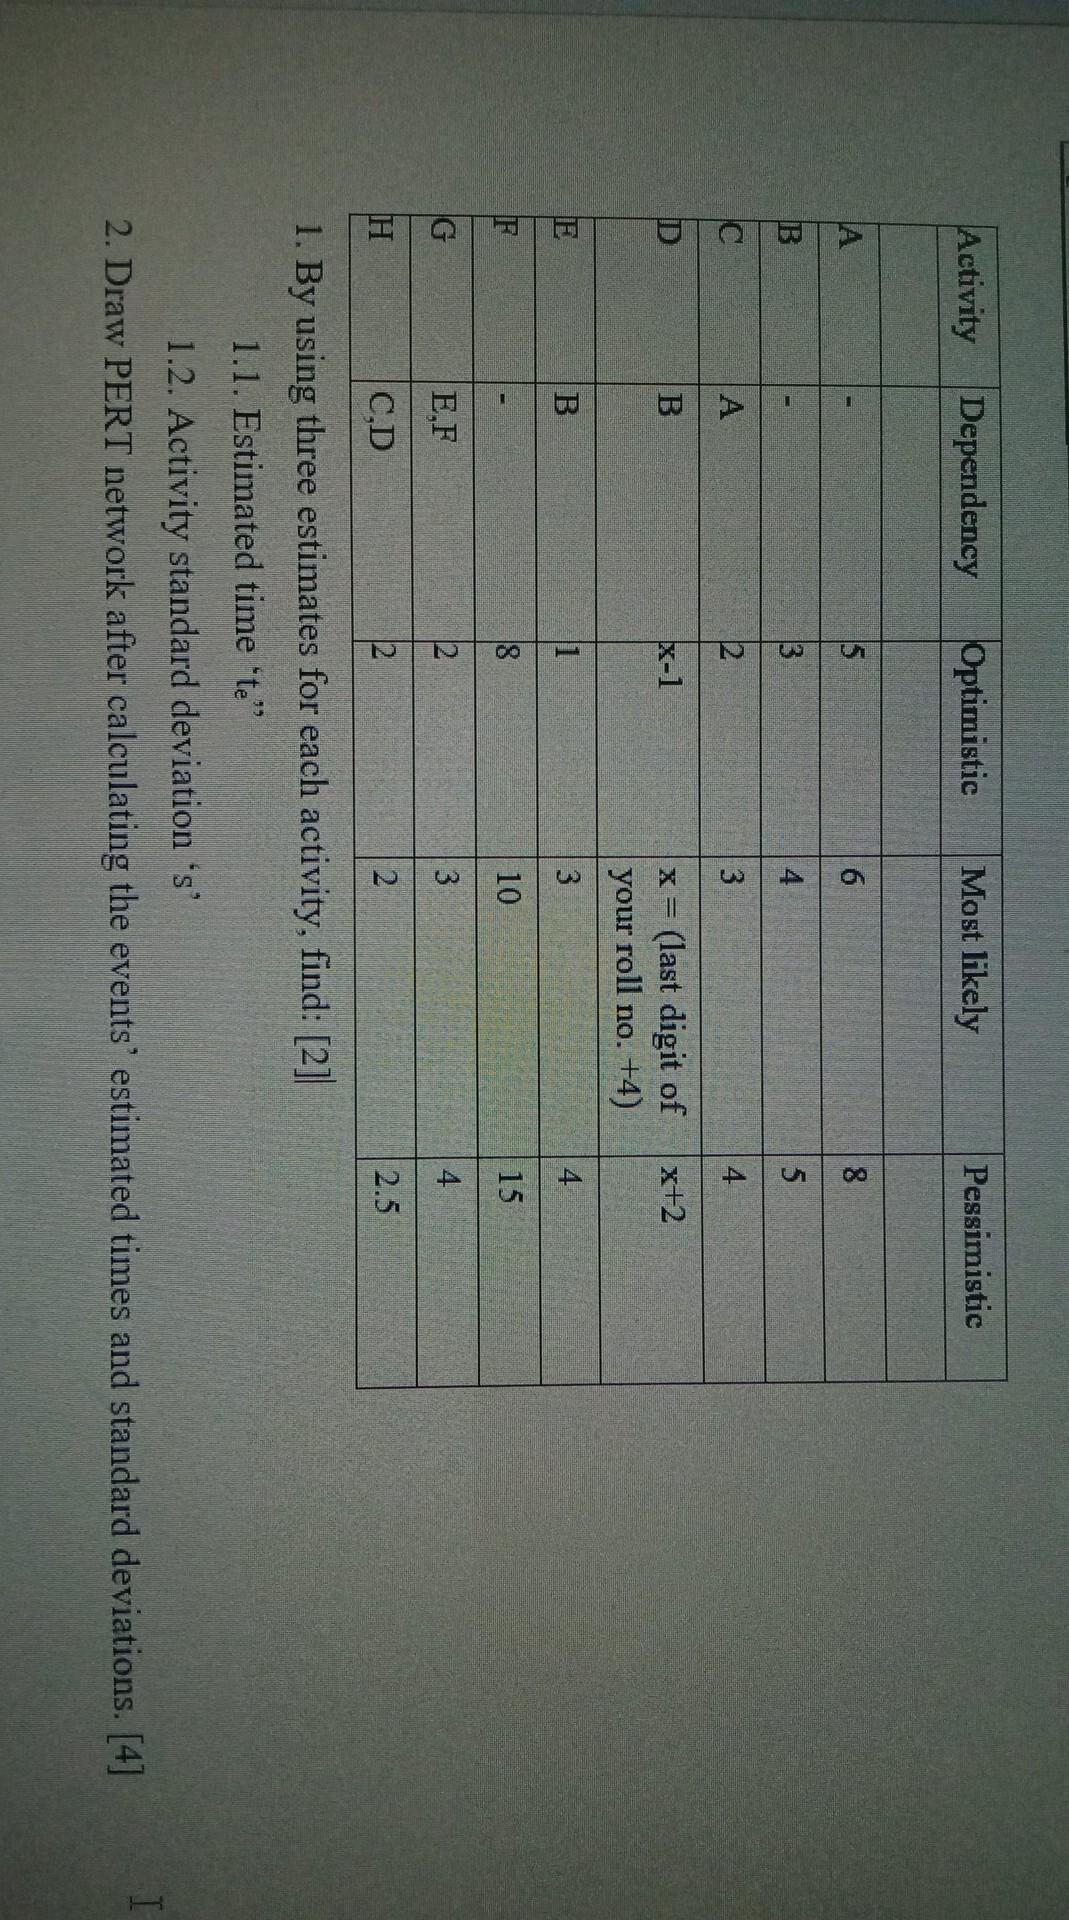
Activity Dependency Optimistic Most likely Pessimistic 6 8 B 3 4 5 C 2 3 4 D B x-1 x+2 x = (last digit of your roll no. +4) 3 B 1 4 F 10 15 G E,F 2 3 4 C,D 2 2 2.5 1. By using three estimates for each activity, find: [2] 1.1. Estimated time 'te" 1.2. Activity standard deviation 's' 2. Draw PERT network after calculating the events estimated times and standard deviations. [4]
Step by Step Solution
There are 3 Steps involved in it
1 Expert Approved Answer
Step: 1 Unlock

Question Has Been Solved by an Expert!
Get step-by-step solutions from verified subject matter experts
Step: 2 Unlock
Step: 3 Unlock