

Question: i need each part solution and step by step and neatly 3. Draw and label the bond market graph covered in chapter 5. Then, using
 i need each part solution and step by step and neatly
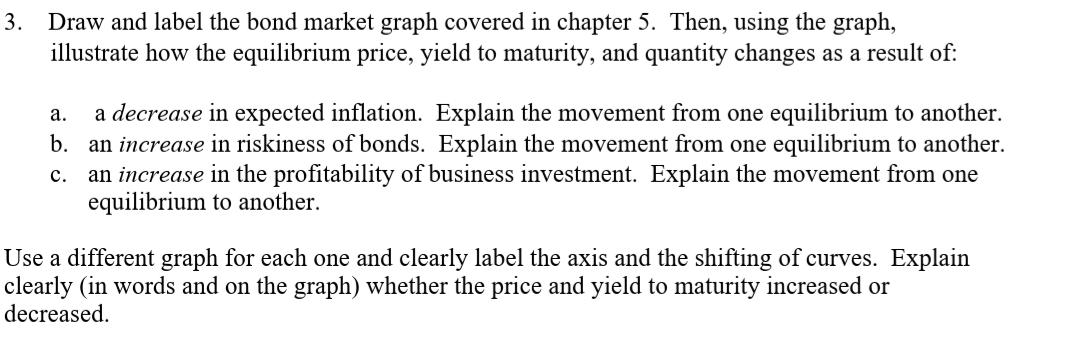
3. Draw and label the bond market graph covered in chapter 5. Then, using the graph, illustrate how the equilibrium price, yield to maturity, and quantity changes as a result of: a. a decrease in expected inflation. Explain the movement from one equilibrium to another. b. an increase in riskiness of bonds. Explain the movement from one equilibrium to another. c. an increase in the profitability of business investment. Explain the movement from one equilibrium to another. Use a different graph for each one and clearly label the axis and the shifting of curves. Explain clearly (in words and on the graph) whether the price and yield to maturity increased or decreased. 3. Draw and label the bond market graph covered in chapter 5. Then, using the graph, illustrate how the equilibrium price, yield to maturity, and quantity changes as a result of: a. a decrease in expected inflation. Explain the movement from one equilibrium to another. b. an increase in riskiness of bonds. Explain the movement from one equilibrium to another. c. an increase in the profitability of business investment. Explain the movement from one equilibrium to another. Use a different graph for each one and clearly label the axis and the shifting of curves. Explain clearly (in words and on the graph) whether the price and yield to maturity increased or decreased
Step by Step Solution
There are 3 Steps involved in it

Get step-by-step solutions from verified subject matter experts