

Question: I need format, please. Square Corp. Income Statement For the Year Ended Dec. 31 Square Corp. Common Size Income Statement For the Year Ended Dec.
I need format, please.
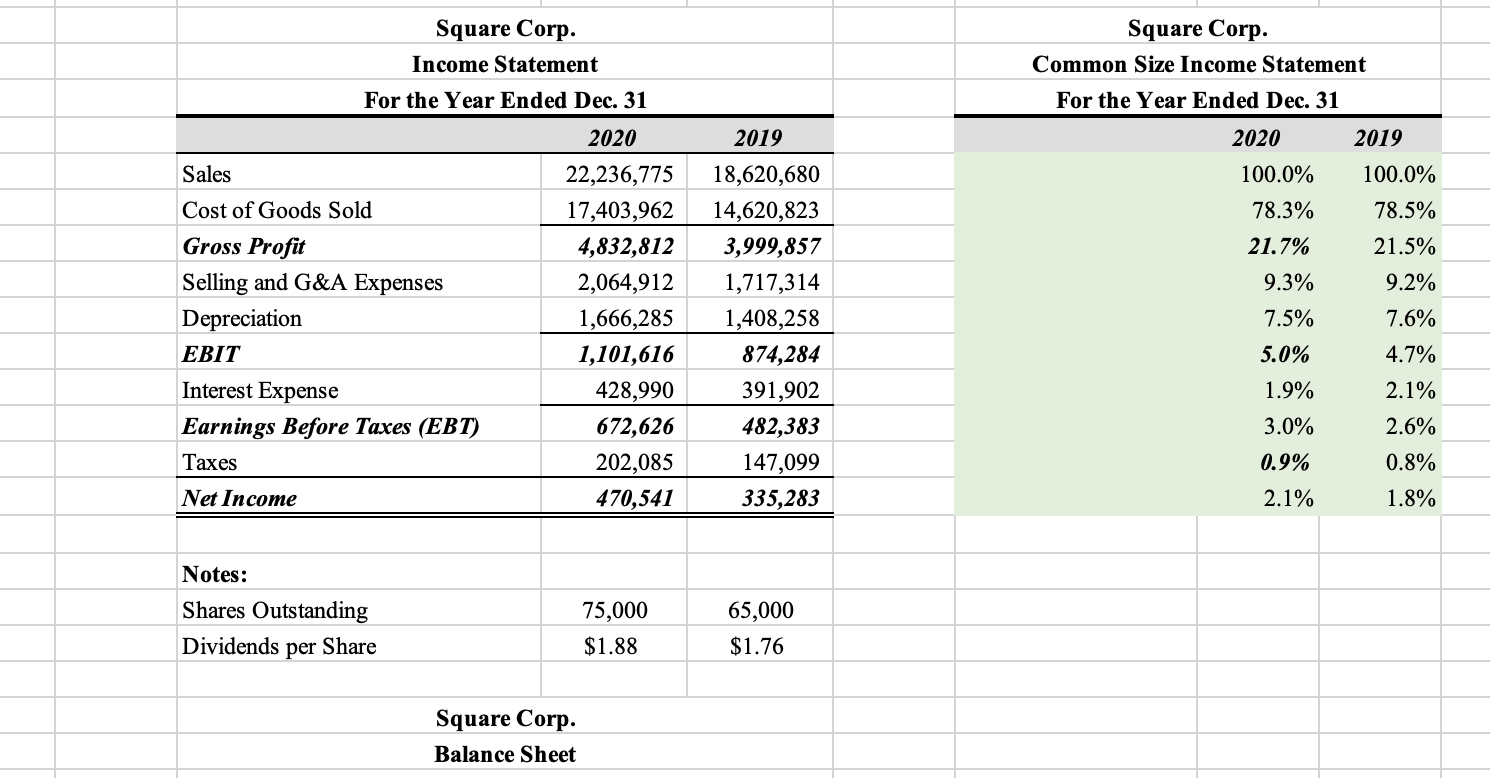
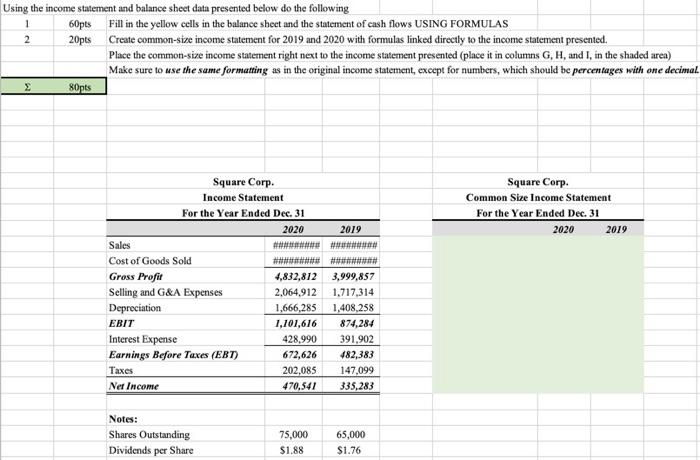
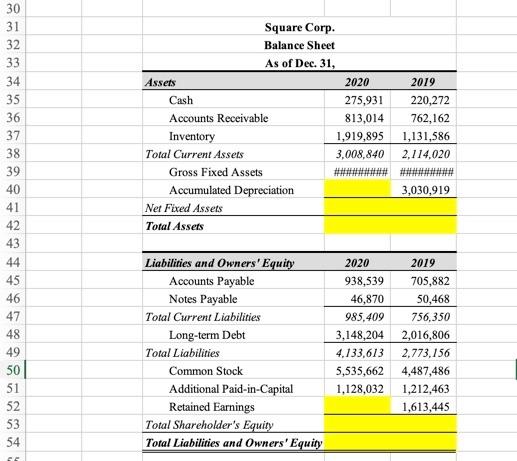
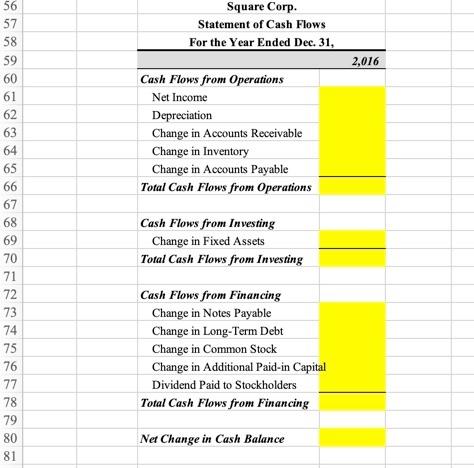
Square Corp. Income Statement For the Year Ended Dec. 31 Square Corp. Common Size Income Statement For the Year Ended Dec. 31 2020 2020 2019 100.0% 100.0% 78.5% 21.5% Sales Cost of Goods Sold Gross Profit Selling and G&A Expenses Depreciation EBIT Interest Expense Earnings Before Taxes (EBT) Taxes 9.2% 78.3% 21.7% 9.3% 7.5% 2019 18,620,680 14,620,823 3,999,857 1,717,314 1,408,258 874,284 391,902 482,383 147,099 335,283 22,236,775 17,403,962 4,832,812 2,064,912 1,666,285 1,101,616 428,990 672,626 202,085 470,541 5.0% 1.9% 7.6% 4.7% 2.1% 2.6% 0.8% 1.8% 3.0% 0.9% 2.1% Net Income Notes: Shares Outstanding Dividends per Share 75,000 $1.88 65,000 $1.76 Square Corp. Balance Sheet Using the income statement and balance sheet data presented below do the following 60pts Fill in the yellow cells in the balance sheet and the statement of cash flows USING FORMULAS 20pts Create common-size income statement for 2019 and 2020 with formulas linked directly to the income statement presented. Place the common-size income statement right next to the income statement presented (place it in columns G, H, and I, in the shaded area) Make sure to use the same formatting as in the original income statement, except for numbers, which should be percentages with one decimal 2 Bopes Square Corp. Common Size Income Statement For the Year Ended Dec. 31 2020 2019 Square Corp. Income Statement For the Year Ended Dec. 31 2020 2019 Sales Cost of Goods Sold Gross Profit 4,832,812 3,999,857 Selling and G&A Expenses 2,064,912 1.717,314 Depreciation 1,666,285 1,408,258 EBIT 1,101,616 874,284 Interest Expense 428,990 391,902 Earnings Before Taxes (EBT) 672,626 482,383 Taxes 202,085 147,099 Net Income 470.541 335,283 Notes: Shares Outstanding Dividends per Share 75,000 $1.88 65,000 $1.76 30 31 32 33 34 35 36 37 38 39 40 41 42 43 44 45 46 47 48 49 50 51 52 53 54 Square Corp. Balance Sheet As of Dec. 31, Assets 2020 2019 Cash 275,931 220,272 Accounts Receivable 813,014 762,162 Inventory 1,919,895 1,131,586 Total Current Assets 3,008,840 2,114.020 Gross Fixed Assets Accumulated Depreciation 3,030,919 Net Fixed Assets Total Assets Liabilities and Owners' Equity Accounts Payable Notes Payable Total Current Liabilities Long-term Debt Total Liabilities Common Stock Additional Paid-in-Capital Retained Earnings Total Shareholder's Equity Total Liabilities and Owners' Equity 2020 2019 938,539 705,882 46,870 50,468 985,409 756,350 3,148,204 2,016,806 4,133,613 2,773.156 5,535,662 4,487,486 1,128,032 1,212,463 1,613,445 Square Corp. Statement of Cash Flows For the Year Ended Dec. 31, 2,016 Cash Flows from Operations Net Income Depreciation Change in Accounts Receivable Change in Inventory Change in Accounts Payable Total Cash Flows from Operations 56 57 58 59 60 61 62 63 64 65 66 67 68 69 70 71 72 73 74 75 76 77 78 79 80 81 Cash Flows from Investing Change in Fixed Assets Total Cash Flows from Investing Cash Flows from Financing Change in Notes Payable Change in Long-Term Debt Change in Common Stock Change in Additional Paid-in Capital Dividend Paid to Stockholders Total Cash Flows from Financing Net Change in Cash Balance Square Corp. Income Statement For the Year Ended Dec. 31 Square Corp. Common Size Income Statement For the Year Ended Dec. 31 2020 2020 2019 100.0% 100.0% 78.5% 21.5% Sales Cost of Goods Sold Gross Profit Selling and G&A Expenses Depreciation EBIT Interest Expense Earnings Before Taxes (EBT) Taxes 9.2% 78.3% 21.7% 9.3% 7.5% 2019 18,620,680 14,620,823 3,999,857 1,717,314 1,408,258 874,284 391,902 482,383 147,099 335,283 22,236,775 17,403,962 4,832,812 2,064,912 1,666,285 1,101,616 428,990 672,626 202,085 470,541 5.0% 1.9% 7.6% 4.7% 2.1% 2.6% 0.8% 1.8% 3.0% 0.9% 2.1% Net Income Notes: Shares Outstanding Dividends per Share 75,000 $1.88 65,000 $1.76 Square Corp. Balance Sheet Using the income statement and balance sheet data presented below do the following 60pts Fill in the yellow cells in the balance sheet and the statement of cash flows USING FORMULAS 20pts Create common-size income statement for 2019 and 2020 with formulas linked directly to the income statement presented. Place the common-size income statement right next to the income statement presented (place it in columns G, H, and I, in the shaded area) Make sure to use the same formatting as in the original income statement, except for numbers, which should be percentages with one decimal 2 Bopes Square Corp. Common Size Income Statement For the Year Ended Dec. 31 2020 2019 Square Corp. Income Statement For the Year Ended Dec. 31 2020 2019 Sales Cost of Goods Sold Gross Profit 4,832,812 3,999,857 Selling and G&A Expenses 2,064,912 1.717,314 Depreciation 1,666,285 1,408,258 EBIT 1,101,616 874,284 Interest Expense 428,990 391,902 Earnings Before Taxes (EBT) 672,626 482,383 Taxes 202,085 147,099 Net Income 470.541 335,283 Notes: Shares Outstanding Dividends per Share 75,000 $1.88 65,000 $1.76 30 31 32 33 34 35 36 37 38 39 40 41 42 43 44 45 46 47 48 49 50 51 52 53 54 Square Corp. Balance Sheet As of Dec. 31, Assets 2020 2019 Cash 275,931 220,272 Accounts Receivable 813,014 762,162 Inventory 1,919,895 1,131,586 Total Current Assets 3,008,840 2,114.020 Gross Fixed Assets Accumulated Depreciation 3,030,919 Net Fixed Assets Total Assets Liabilities and Owners' Equity Accounts Payable Notes Payable Total Current Liabilities Long-term Debt Total Liabilities Common Stock Additional Paid-in-Capital Retained Earnings Total Shareholder's Equity Total Liabilities and Owners' Equity 2020 2019 938,539 705,882 46,870 50,468 985,409 756,350 3,148,204 2,016,806 4,133,613 2,773.156 5,535,662 4,487,486 1,128,032 1,212,463 1,613,445 Square Corp. Statement of Cash Flows For the Year Ended Dec. 31, 2,016 Cash Flows from Operations Net Income Depreciation Change in Accounts Receivable Change in Inventory Change in Accounts Payable Total Cash Flows from Operations 56 57 58 59 60 61 62 63 64 65 66 67 68 69 70 71 72 73 74 75 76 77 78 79 80 81 Cash Flows from Investing Change in Fixed Assets Total Cash Flows from Investing Cash Flows from Financing Change in Notes Payable Change in Long-Term Debt Change in Common Stock Change in Additional Paid-in Capital Dividend Paid to Stockholders Total Cash Flows from Financing Net Change in Cash Balance
Step by Step Solution
There are 3 Steps involved in it

Get step-by-step solutions from verified subject matter experts