

Question: I need help 5,6 The table shown below displays a collection of vehicle preference data a dealership utilizes to make predictions pertaining to Inventory. Vehicle
I need help 5,6
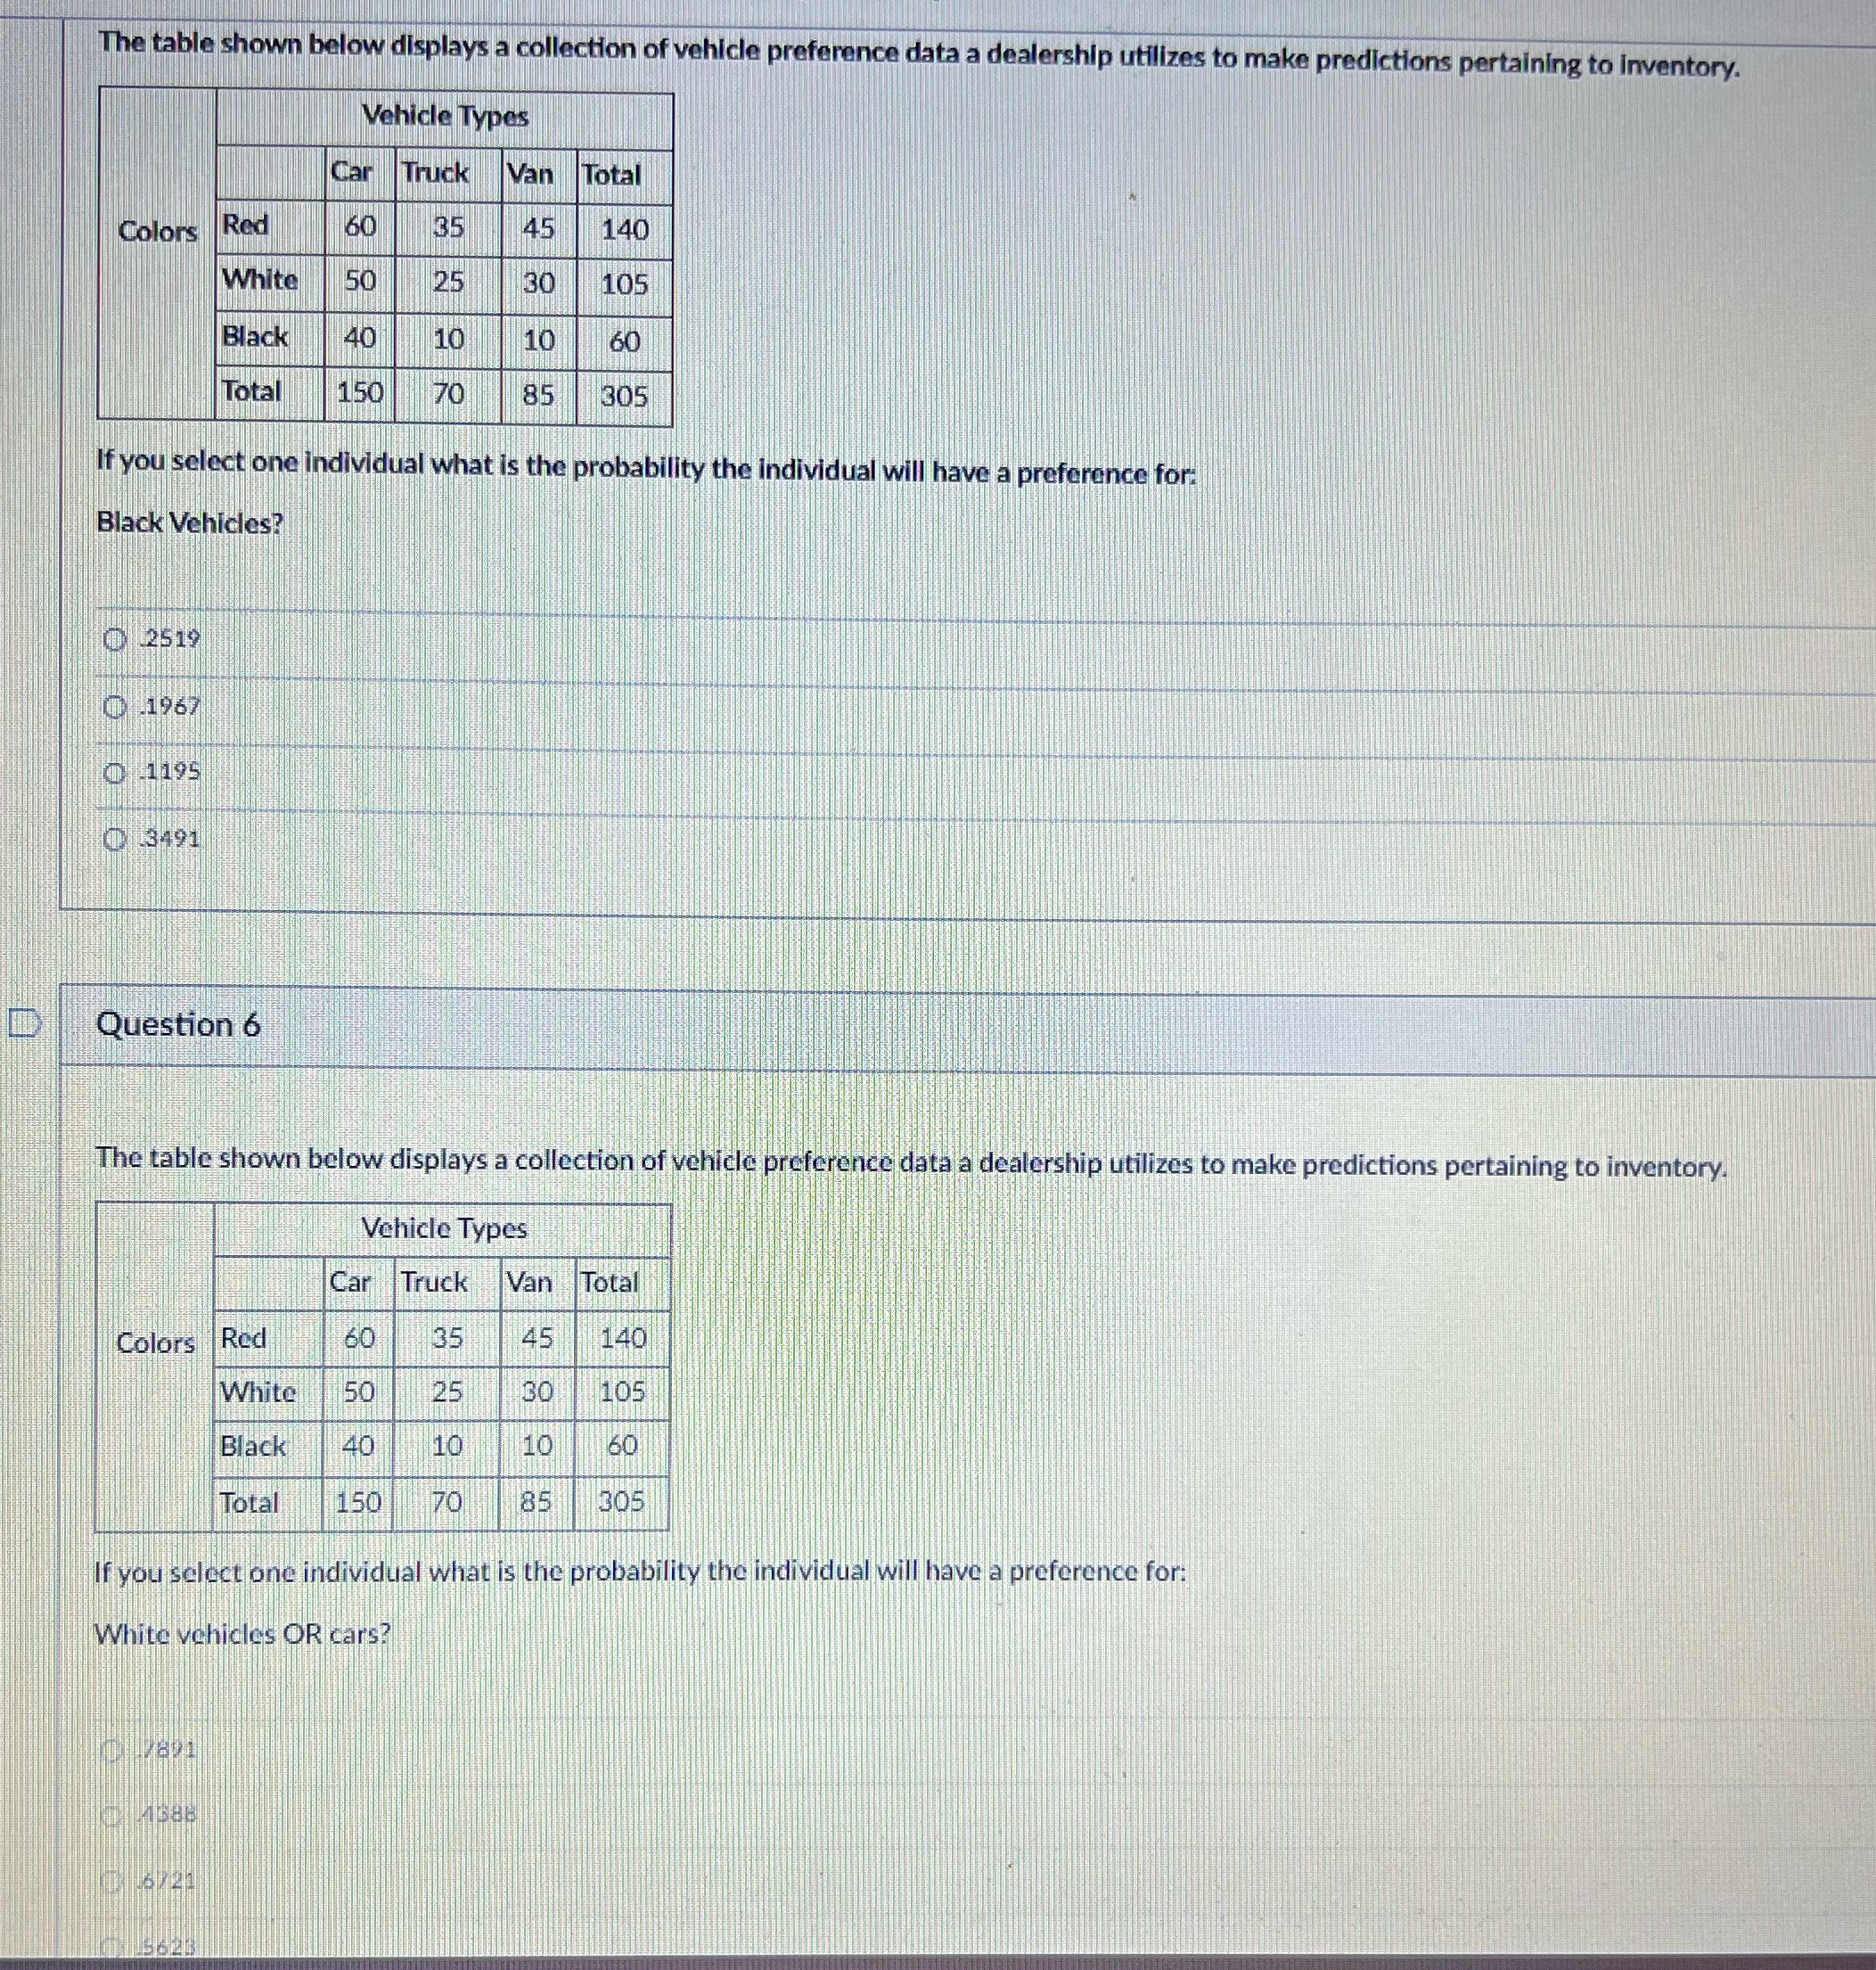
The table shown below displays a collection of vehicle preference data a dealership utilizes to make predictions pertaining to Inventory. Vehicle Types Car Truck Van Total Colors Red 35 45 140 White 50 25 30 105 Black 40 10 60 Tota 150 85 305 f you select one individual what is the probability the individual will have a preference for: Black Vehicles? D 2519 -1967 0 -1195 O .3491 Question 6 The table shown below displays a collection of vehicle preference data a dealership utilizes to make predictions pertaining to inventory. Vehicle Types Car Truck Van Total Colors Red 35 45 140 White 50 25 105 Black 40 10 10 60 Total 150 70 85 305 If you select one individual what is the probability the individual will have a preference for: White vehicles OR cars
Step by Step Solution
There are 3 Steps involved in it

Get step-by-step solutions from verified subject matter experts