

Question: I need help about this! Question 2 2 Points The process of analyzing sample data in order to draw conclusions about the characteristics of a
I need help about this!
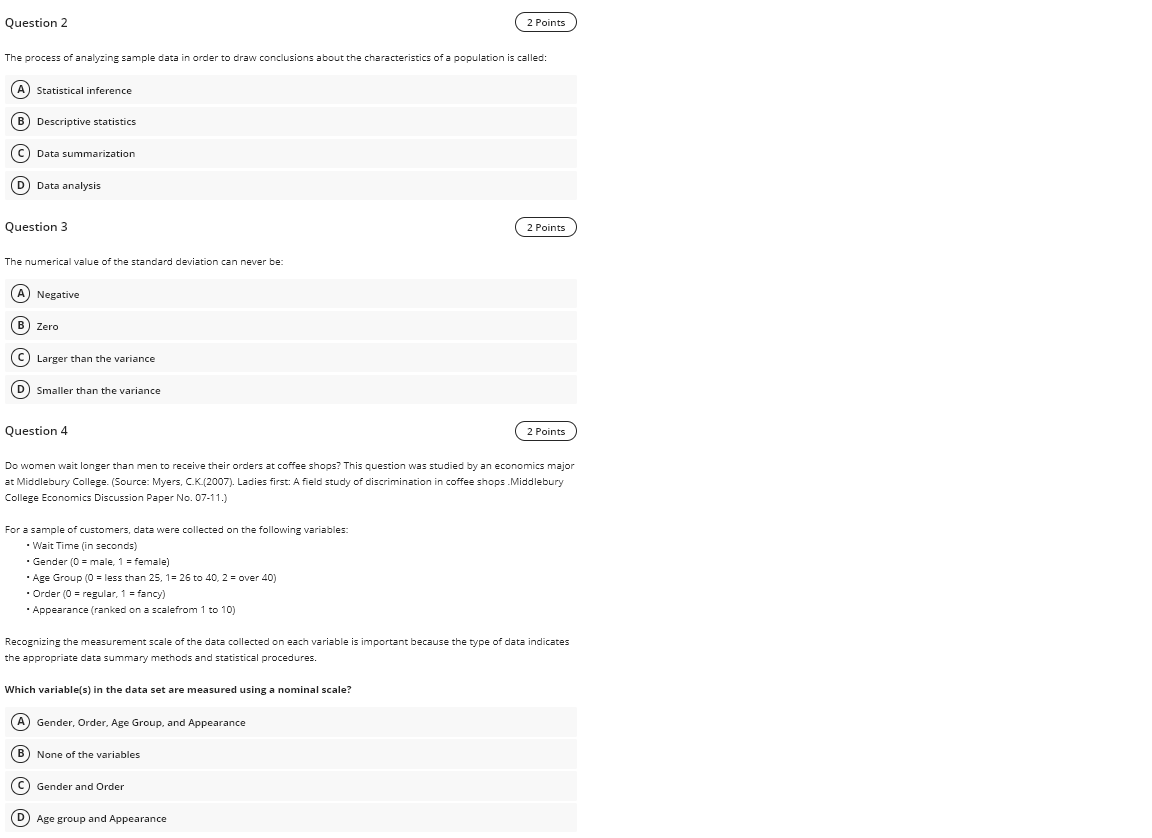
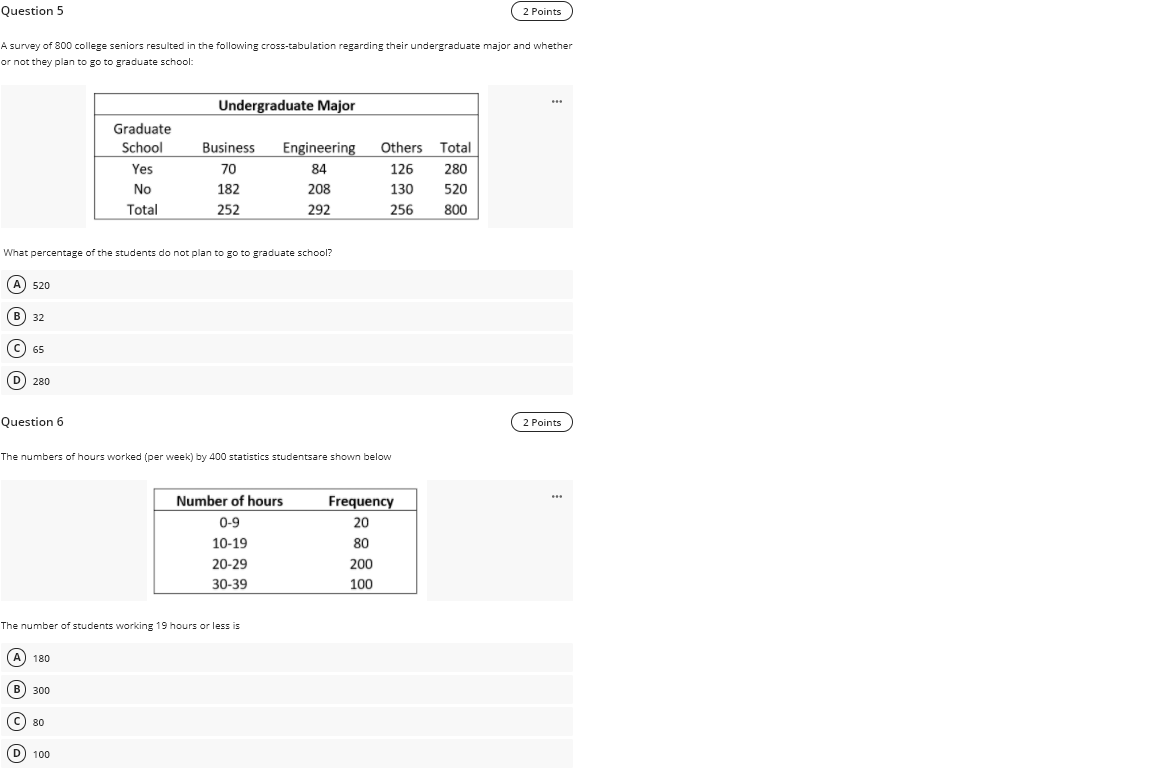
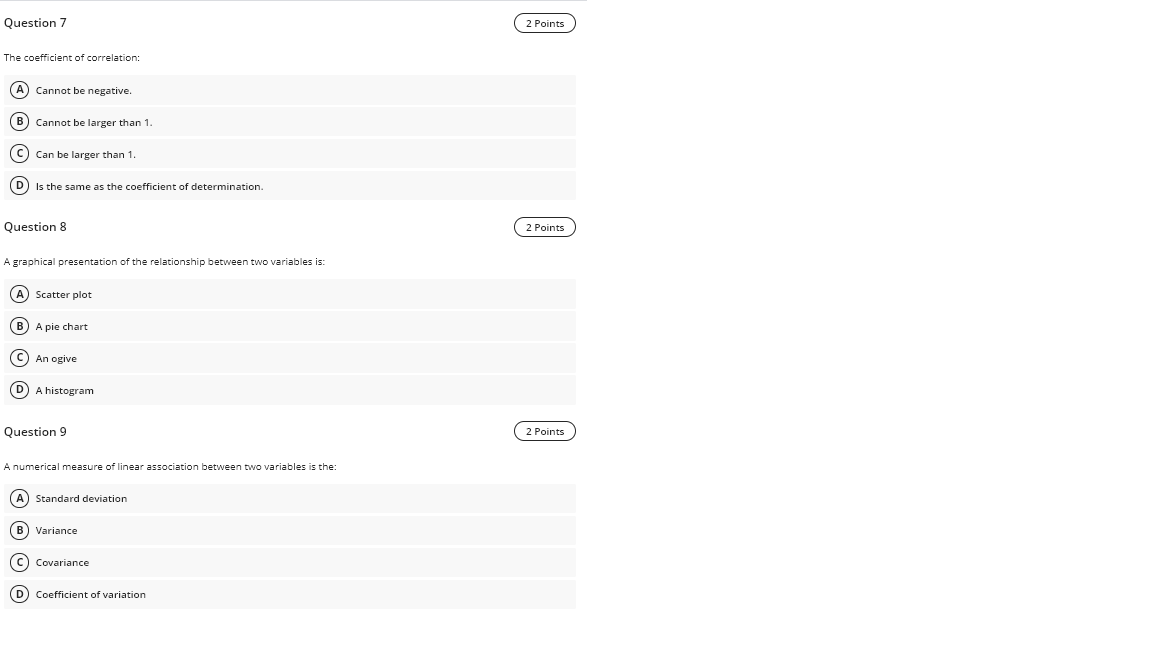
Question 2 2 Points The process of analyzing sample data in order to draw conclusions about the characteristics of a population is called: A) Statistical inference B Descriptive statistics C Data summarization D Data analysis Question 3 2 Points The numerical value of the standard deviation can never be: A) Negative 3) Zero C) Larger than the variance D ) Smaller than the variance Question 4 2 Points Do women wait longer than men to receive their orders at coffee shops? This question was studied by an economics major at Middlebury College. (Source: Myers, C.K_(2007). Ladies first: A field study of discrimination in coffee shops .Middlebury College Economics Discussion Paper No. 07-11.) For a sample of customers, data were collected on the following variables: . Wait Time (in seconds) Gender (0 = male, 1 = female) Age Group (0 = less than 25, 1= 26 to 40, 2 = over 40) Order (0 = regular, 1 = fancy) Appearance (ranked on a scalefrom 1 to 10) Recognizing the measurement scale of the data collected on each variable is important because the type of data indicates the appropriate data summary methods and statistical procedures. Which variable(s) in the data set are measured using a nominal scale? A) Gender, Order, Age Group, and Appearance B) None of the variables C Gender and Order D Age group and AppearanceQuestion 5 2 Points A survey of 800 college seniors resulted in the following cross-tabulation regarding their undergraduate major and whether or not they plan to go to graduate school: Undergraduate Major Graduate School Business Engineering Others Total Yes 70 84 126 280 No 182 208 130 520 Total 252 292 256 800 What percentage of the students do not plan to go to graduate school? (A) 520 B) 32 C 65 D 280 Question 6 2 Points The numbers of hours worked (per week) by 400 statistics studentsare shown below Number of hours Frequency 0-9 20 10-19 80 20-29 200 30-39 100 The number of students working 19 hours or less is A) 180 300 C 80 D) 100Question 7 2 Points The coefficient of correlation: A) Cannot be negative. B Cannot be larger than 1. C Can be larger than 1. D Is the same as the coefficient of determination. Question 8 2 Points A graphical presentation of the relationship between two variables is: A) Scatter plot B A pie chart C) An ogive D A histogram Question 9 2 Points A numerical measure of linear association between two variables is the: Standard deviation B Variance C Covariance D Coefficient of variation
Step by Step Solution
There are 3 Steps involved in it

Get step-by-step solutions from verified subject matter experts