

Question: I need help analyzing and computing the data found in the attached spreadsheet. (10.2 2A) The comparisons of Scholastic Aptitude Test (SAT) scores based on
I need help analyzing and computing the data found in the attached spreadsheet. (10.2 2A)
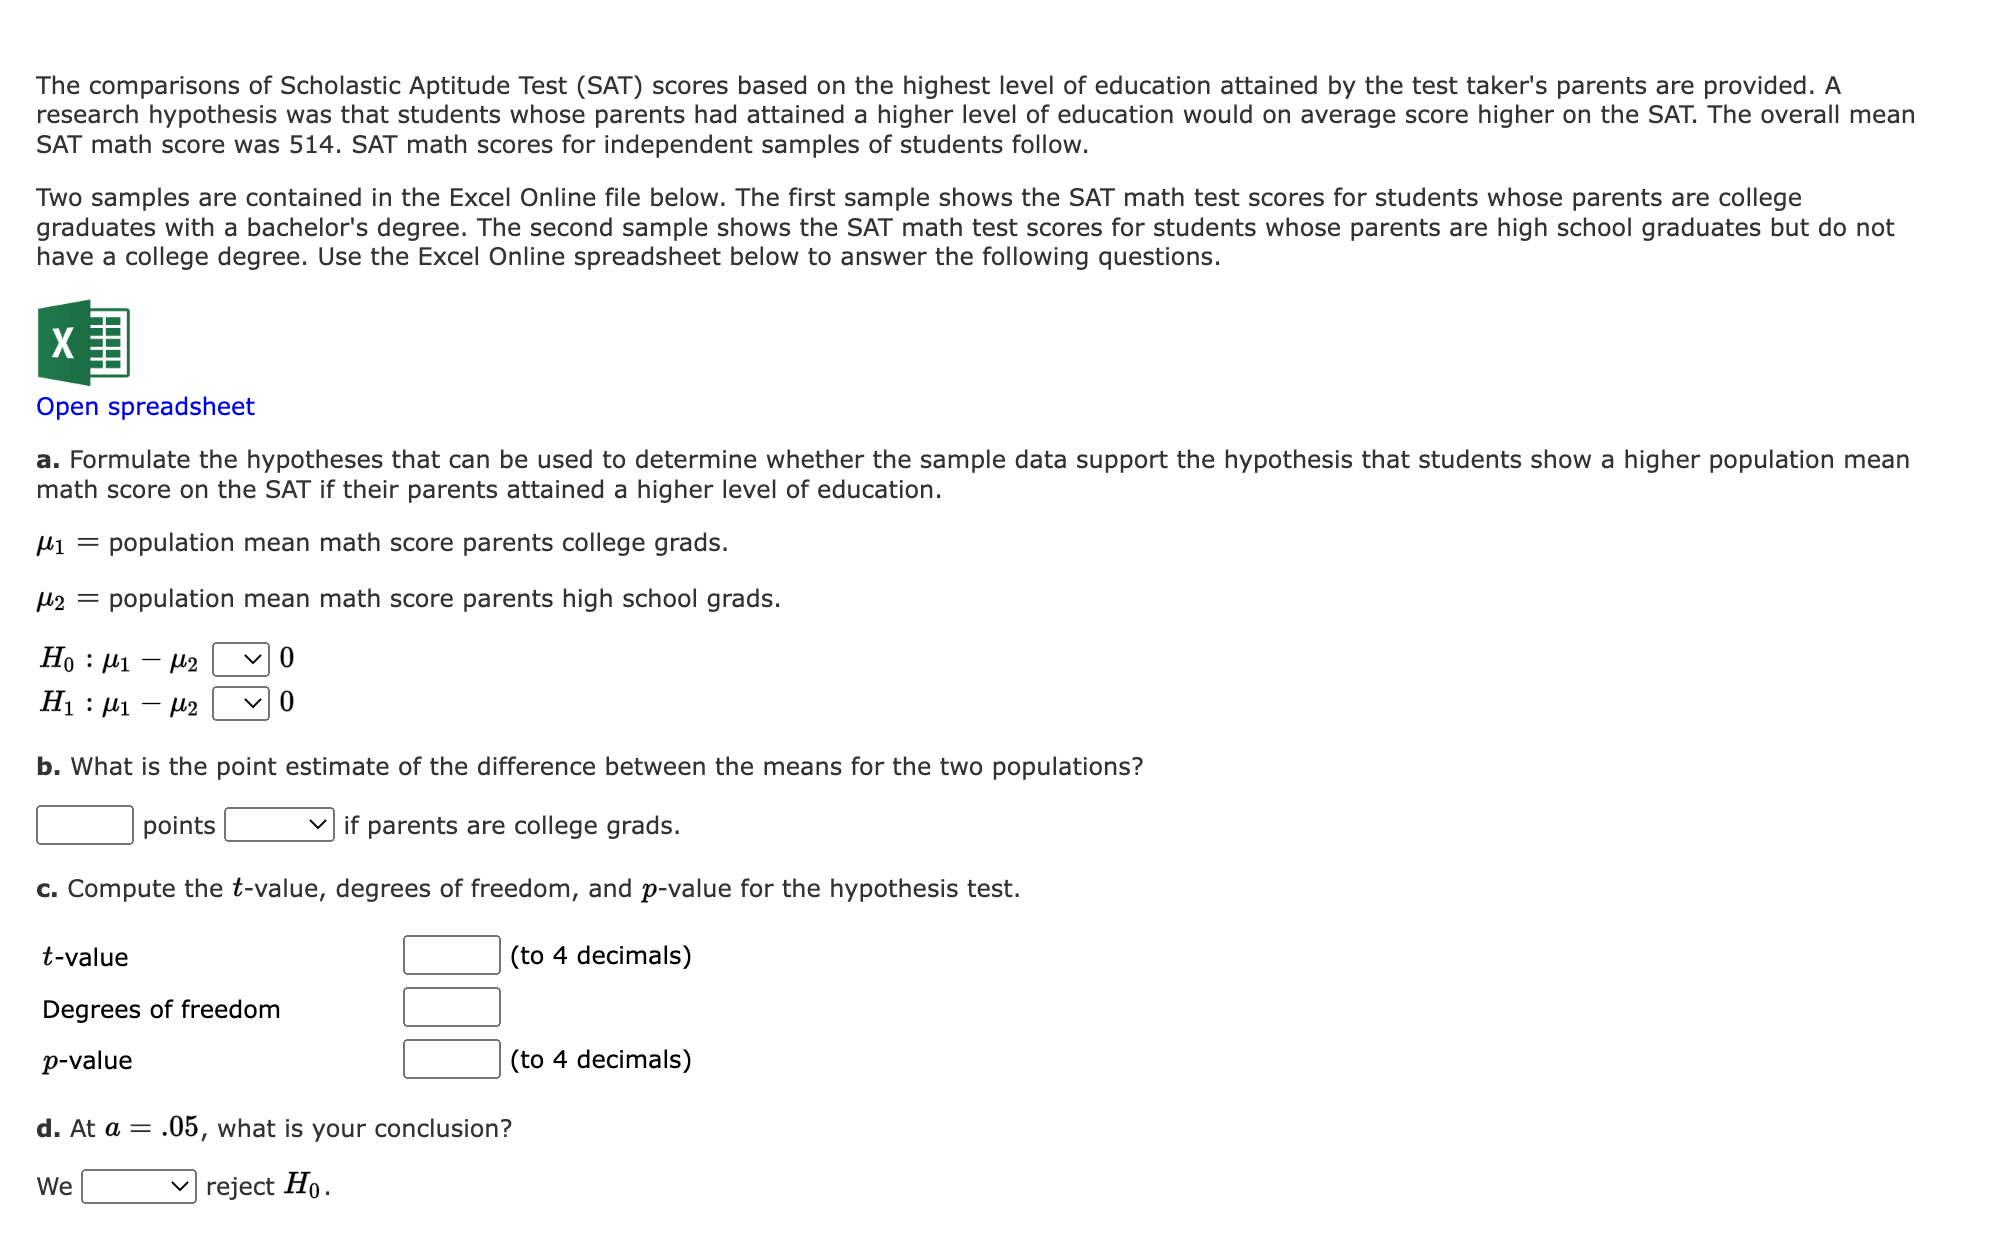
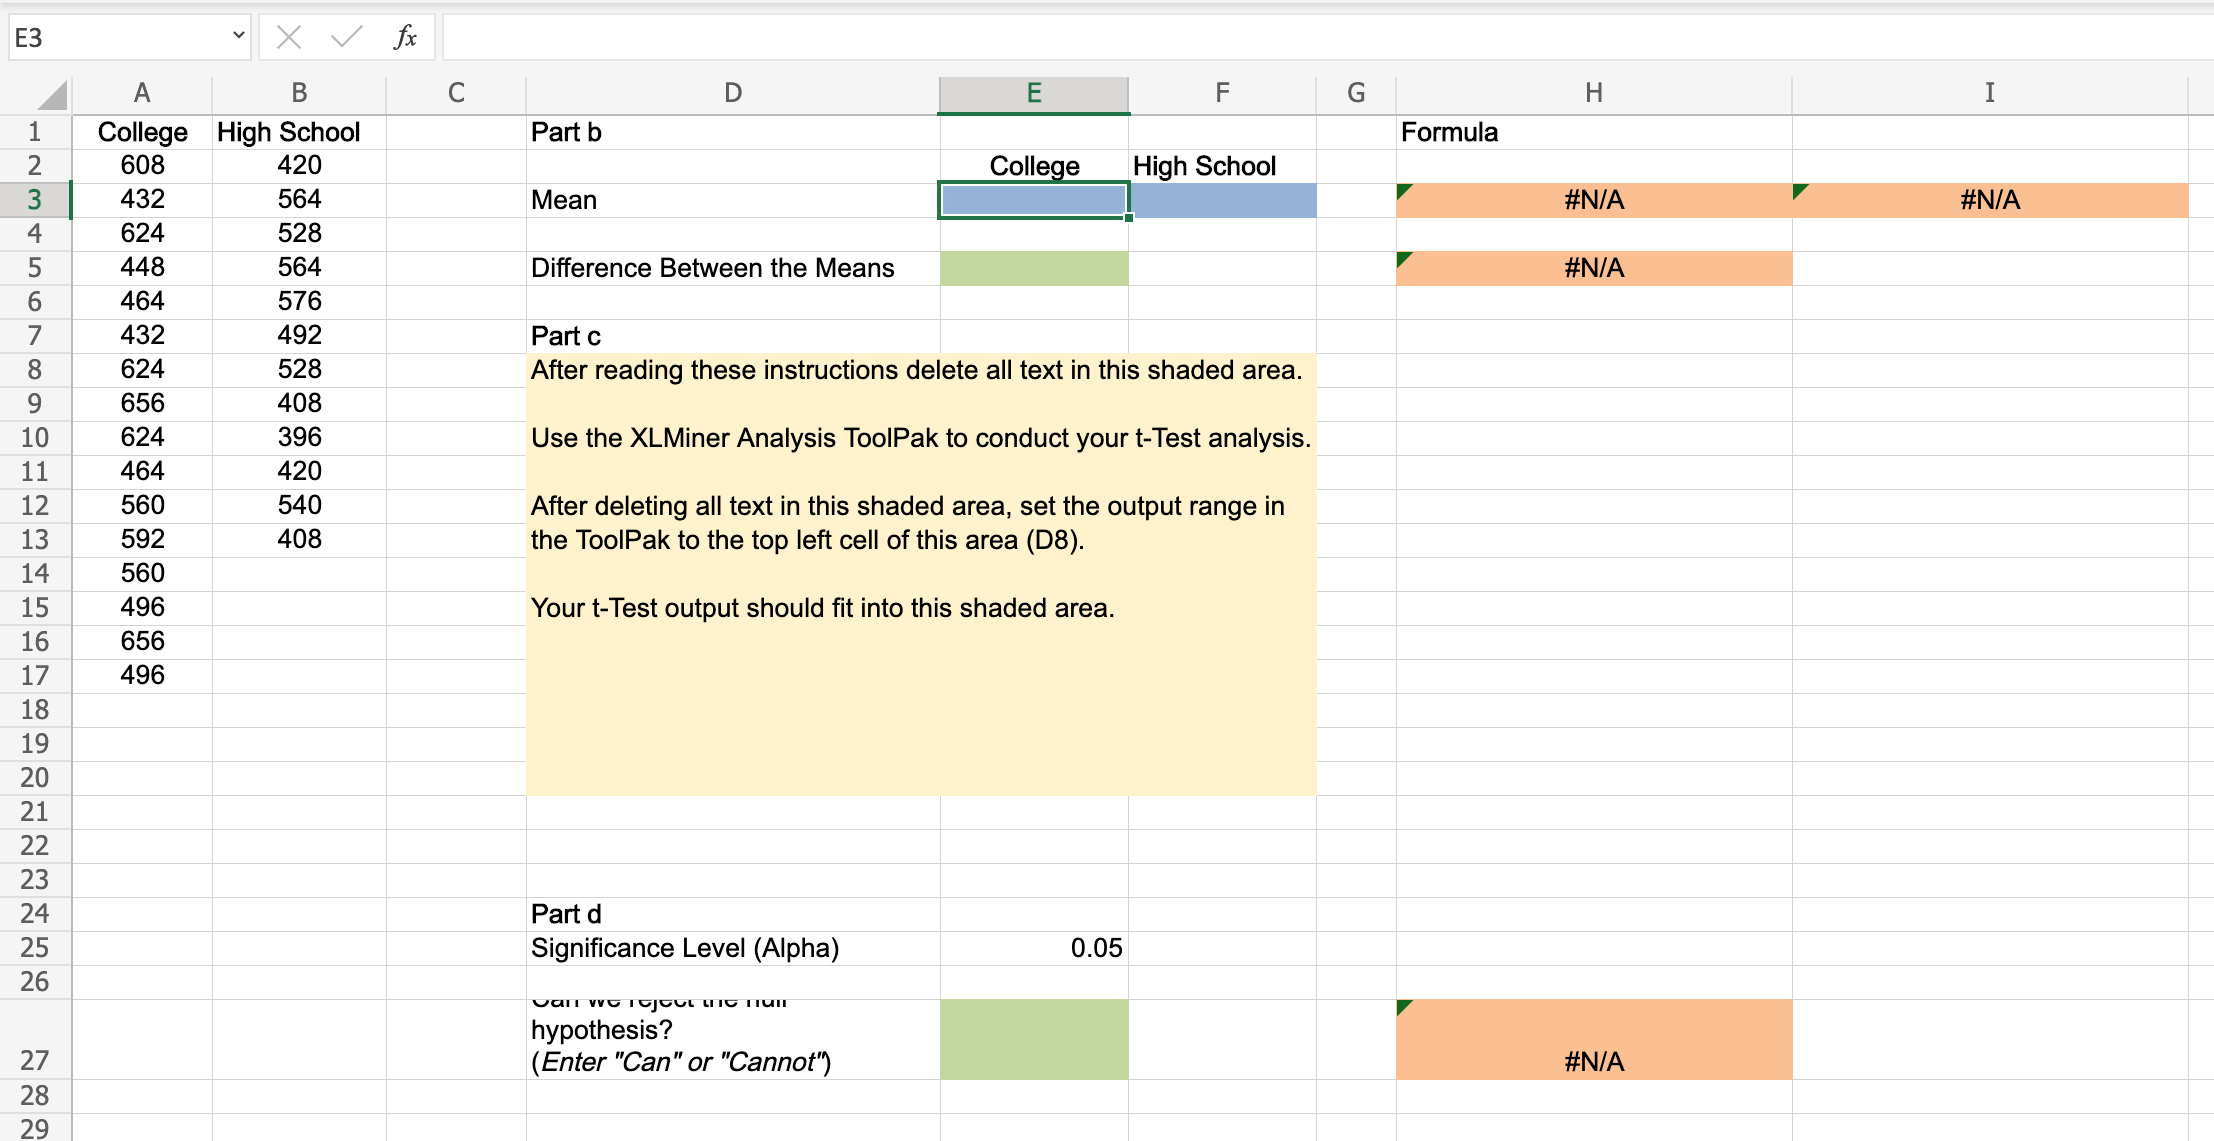
The comparisons of Scholastic Aptitude Test (SAT) scores based on the highest level of education attained by the test taker's parents are provided. A research hypothesis was that students whose parents had attained a higher level of education would on average score higher on the SAT. The overall mean SAT math score was 514. SAT math scores for independent samples of students follow. Two samples are contained in the Excel Online file below. The rst sample shows the SAT math test scores for students whose parents are college graduates with a bachelor's degree. The second sample shows the SAT math test scores for students whose parents are high school graduates but do not have a college degree. Use the Excel Online spreadsheet below to answer the following questions. Open spreadsheet a. Formulate the hypotheses that can be used to determine whether the sample data support the hypothesis that students show a higher population mean math score on the SAT if their parents attained a higher level of education. [1.1 = population mean math score parents college grads. [1.2 2 population mean math score parents high school grads. HoimMz :]0 H1:].L1y.2 :]0 b. What is the point estimate of the difference between the means for the two populations? points v if parents are college grads. c. Compute the t-value, degrees of freedom, and p-value for the hypothesis test. t-value (to 4 decimals) Degrees of freedom pvalue (to 4 decimals) d. At a = .05, what is your conclusion? We reject Ho. E3 v X \\/ t A 4 B D F 4 H 1 College High School Part D Formula 2 608 420 Colle e High School - 432 564 Mean Ii: 4 624 528 i s 448 564 oierence Between the Means :_:, 6 464 576 7 432 492 Part c 8 624 528 After reading these instructions delete all text in this shaded area. 9 656 408 10 624 396 Use the XLMiner Analysis TooIPak to conduct your t-Test analysis. 1 1 464 420 12 560 540 After deleting all text in this shaded area, set the output range in 13 592 408 the ToolPak to the top left cell of this area (DB). 14 560 15 496 Your t-Test output should t into this shaded area. 16 656 17 496 18 19 20 21 22 23 24 Part d 25 Signicance Level (Alpha) 0.05 26 _ hypothesis? - 27 (Enter "Can\" or "Cannot? , 28 29
Step by Step Solution
There are 3 Steps involved in it

Get step-by-step solutions from verified subject matter experts