

Question: I need help analyzing and computing the data found in the attached spreadsheet. 10.2 E2 v X V fx F G H B C D
I need help analyzing and computing the data found in the attached spreadsheet. 10.2
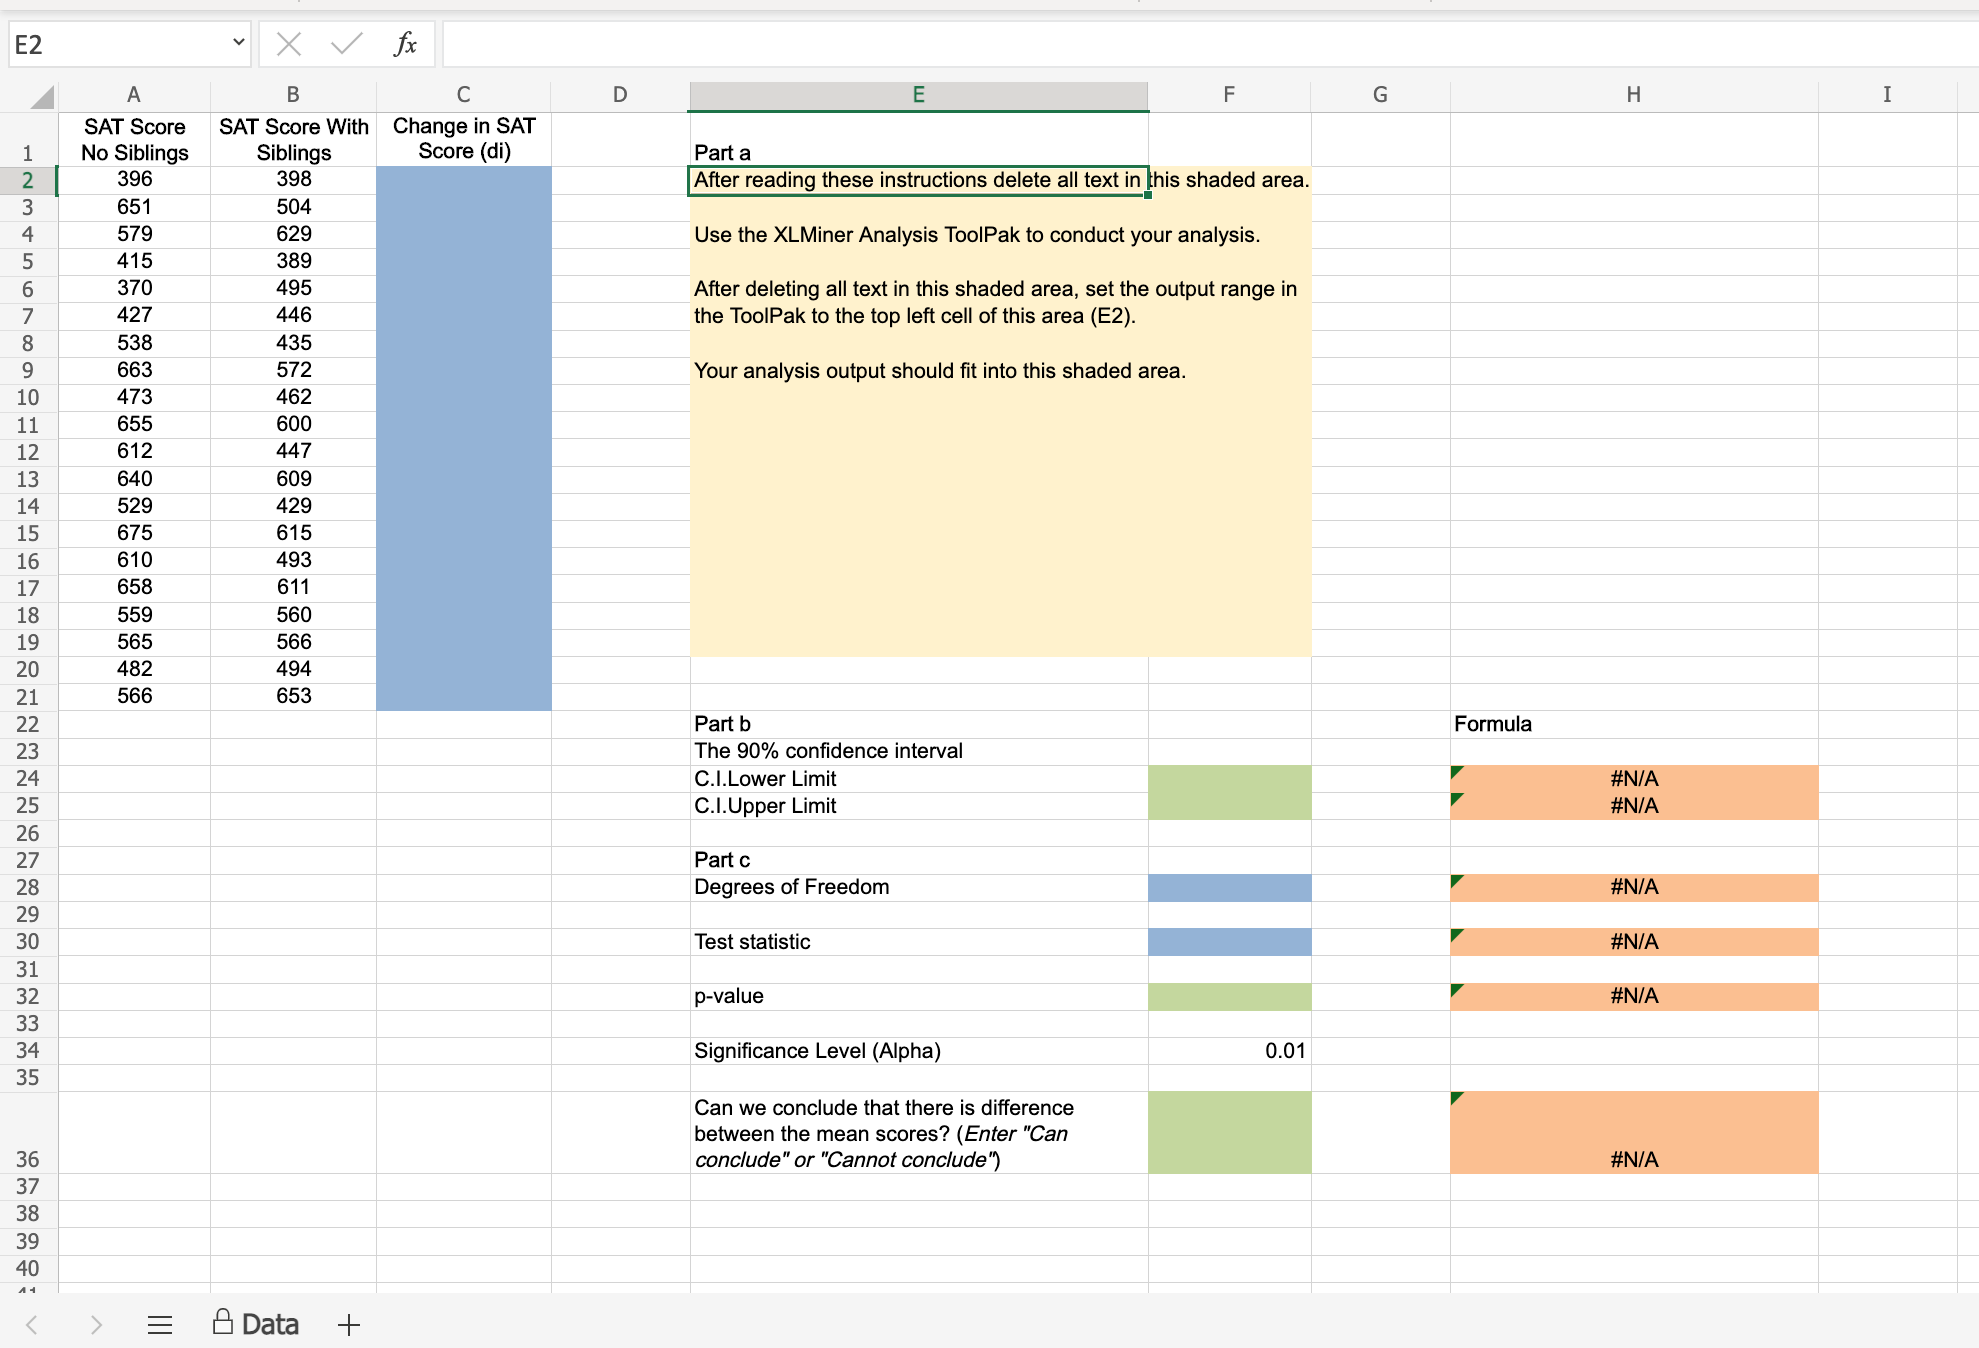
E2 v X V fx F G H B C D E SAT Score SAT Score With Change in SAT No Siblings Siblings Score (di) Part a 396 398 After reading these instructions delete all text in this shaded area. 651 504 629 Use the XLMiner Analysis ToolPak to conduct your analysis. 579 415 389 370 495 After deleting all text in this shaded area, set the output range in 427 446 the ToolPak to the top left cell of this area (E2). 538 435 663 Your analysis output should fit into this shaded area. 672 10 473 462 11 655 600 12 612 447 13 640 609 14 529 429 15 675 615 16 610 493 17 658 611 18 559 560 19 565 566 20 482 494 21 566 653 Formula 22 Part b The 90% confidence interval 23 #N/A C.I.Lower Limit 24 #N/A 25 C.I.Upper Limit 26 27 Part c #N/A 28 Degrees of Freedom 29 #N/A 30 Test statistic 31 #N/A p-value 32 Significance Level (Alpha) 0.01 34 35 Can we conclude that there is difference between the mean scores? (Enter "Can #N/A conclude" or "Cannot conclude") 36 37 38 = & Data +
Step by Step Solution
There are 3 Steps involved in it

Get step-by-step solutions from verified subject matter experts