

Question: I need help analyzing and computing the data found in the attached spreadsheet. 15.5 Major League Baseball (MLB) consists of teams that play in the
I need help analyzing and computing the data found in the attached spreadsheet. 15.5
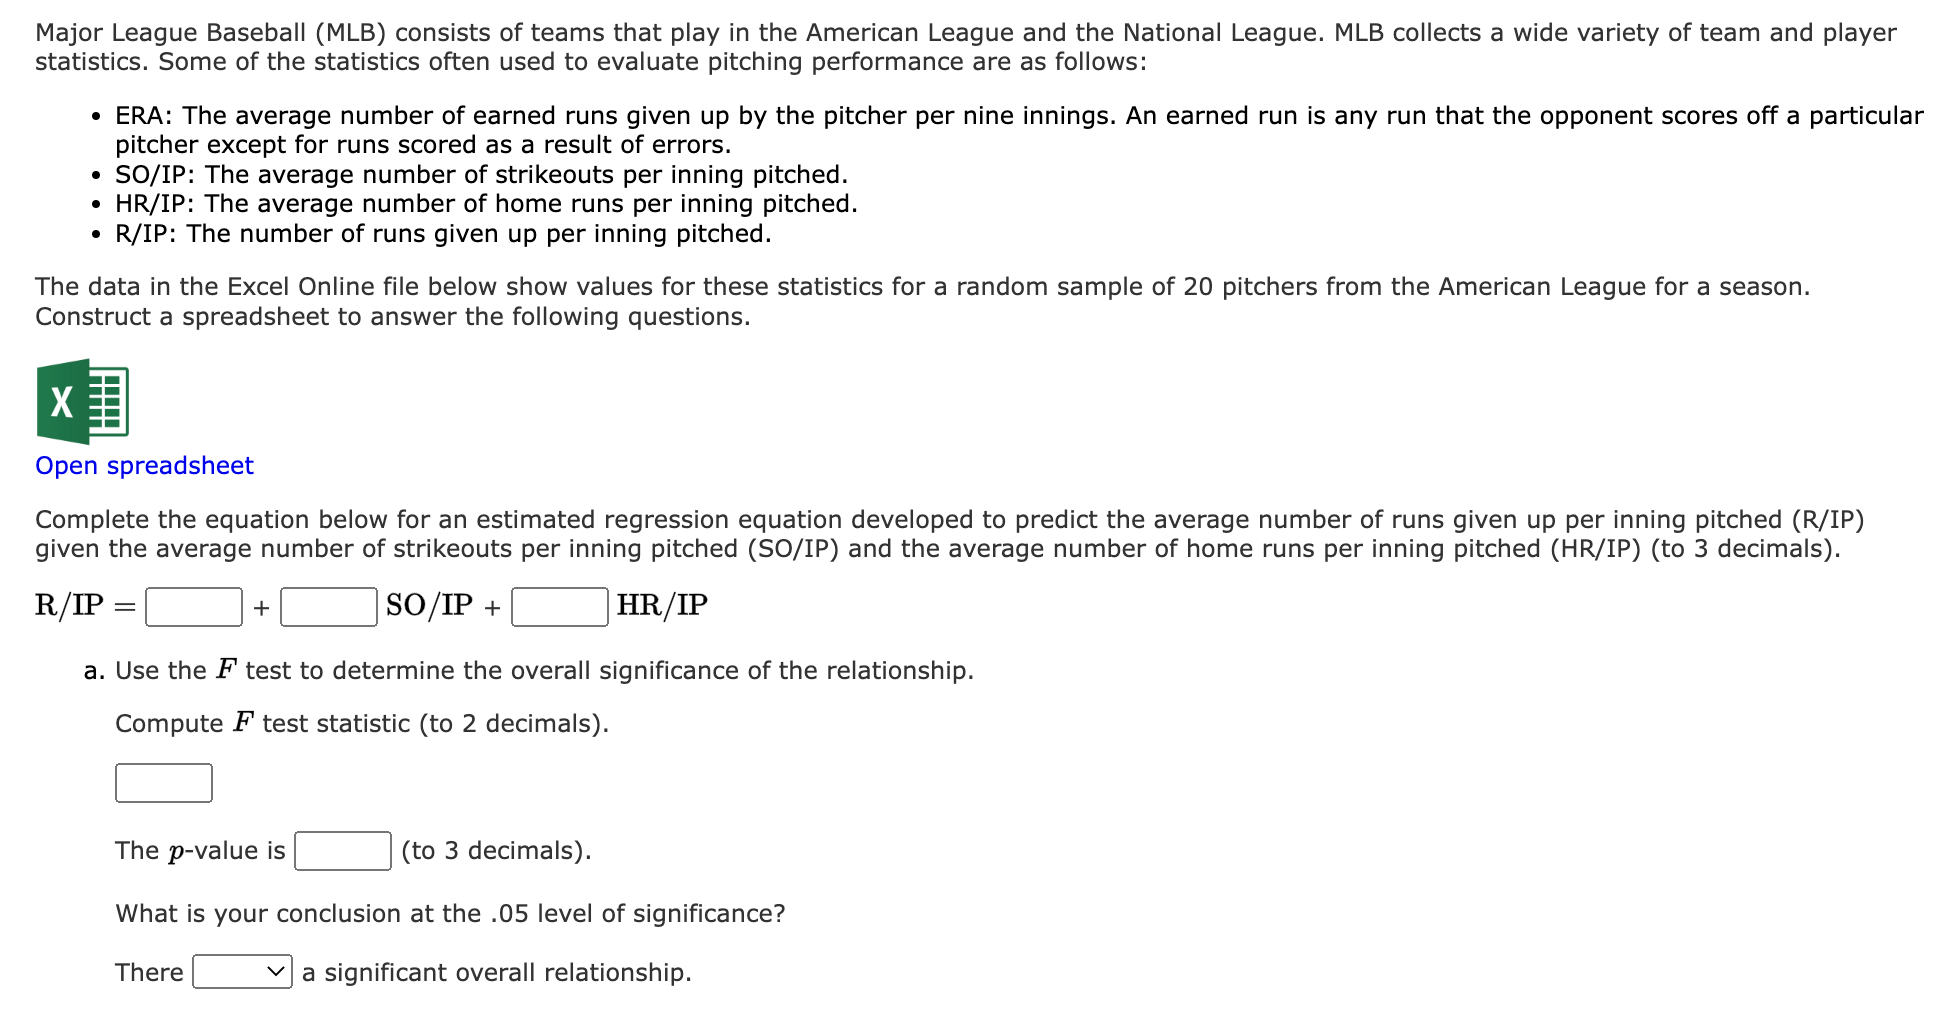
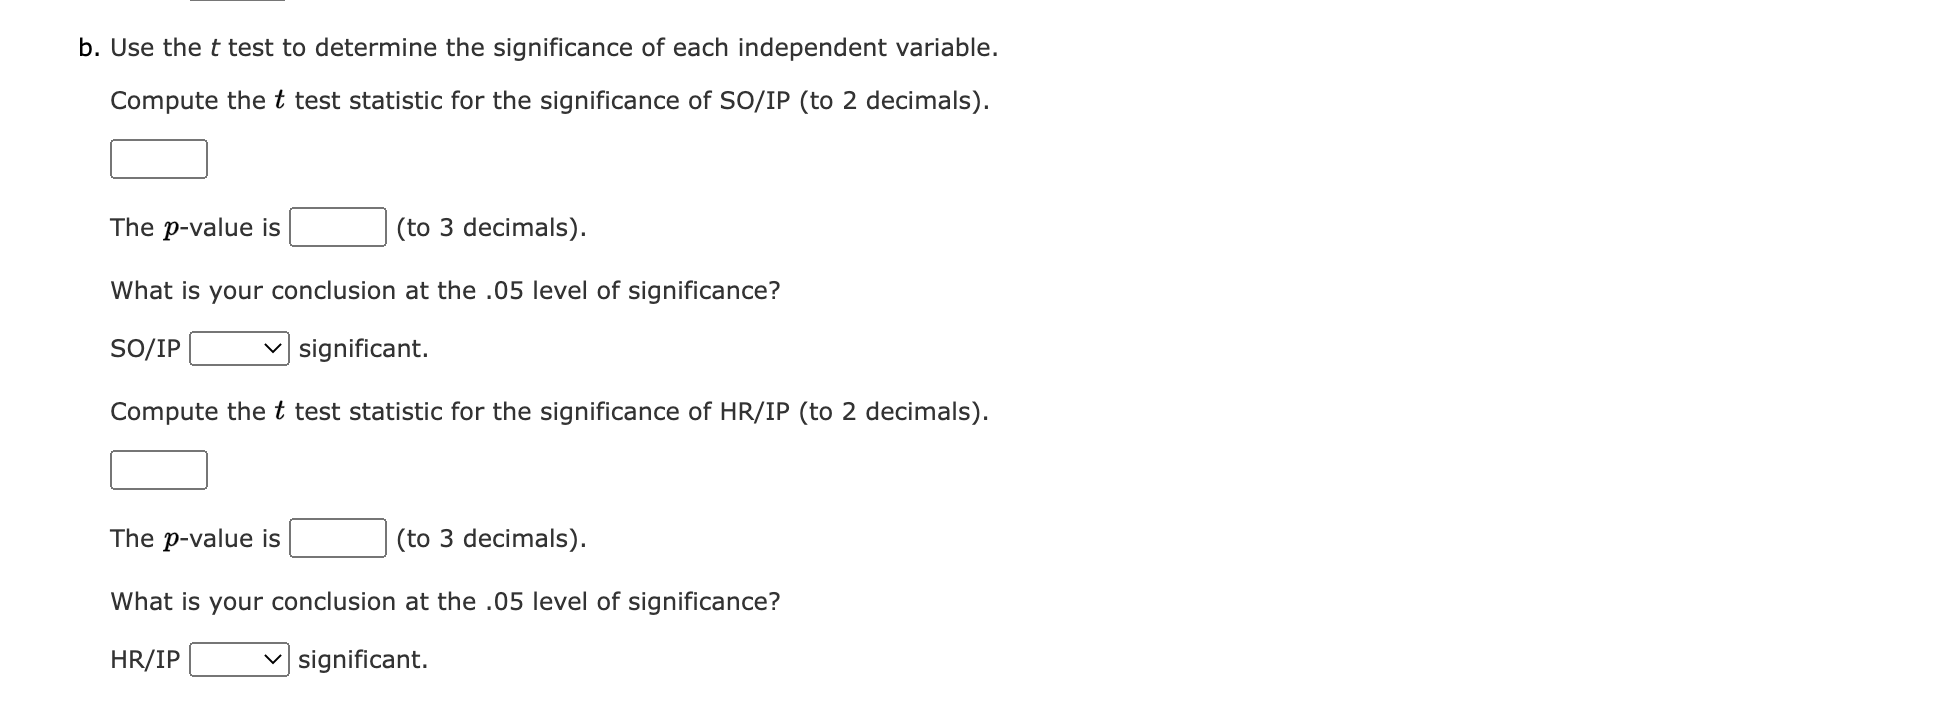
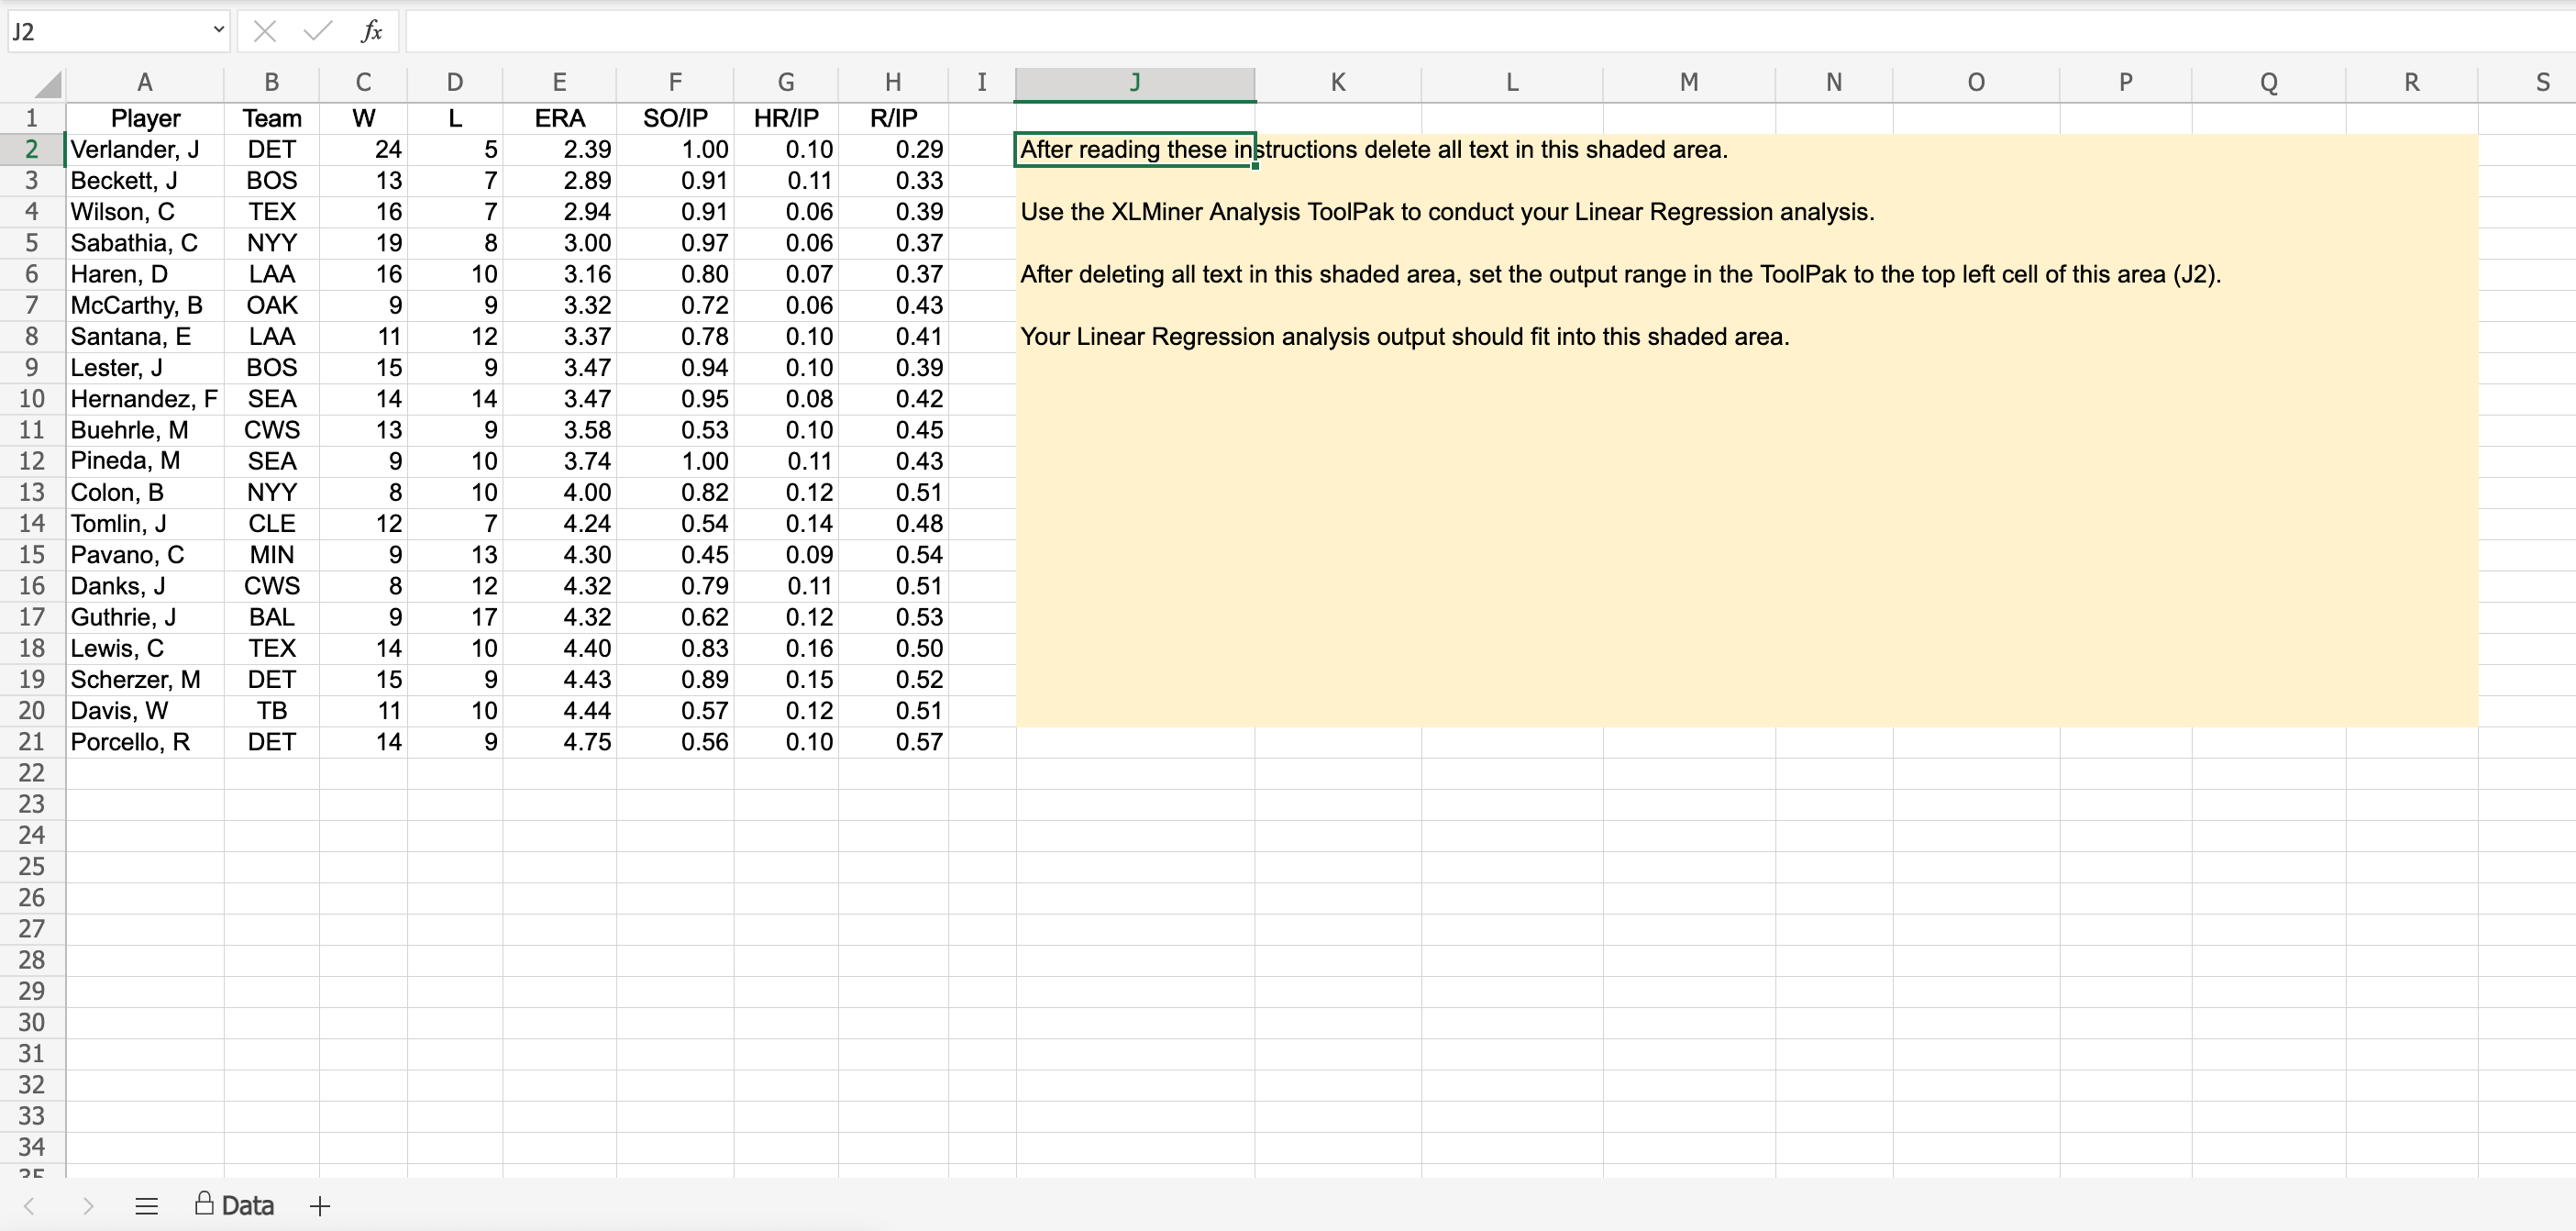
Major League Baseball (MLB) consists of teams that play in the American League and the National League. MLB collects a wide variety of team and player statistics. Some of the statistics often used to evaluate pitching performance are as follows: - ERA: The average number of earned runs given up by the pitcher per nine innings. An earned run is any run that the opponent scores off a particular pitcher except for runs scored as a result of errors. - SO/IP: The average number of strikeouts per inning pitched. . HR/IP: The average number of home runs per inning pitched. - R/IP: The number of runs given up per inning pitched. The data in the Excel Online le below show values for these statistics for a random sample of 20 pitchers from the American League for a season. Construct a spreadsheet to answer the following questions. Open spreadsheet Complete the equation below for an estimated regression equation developed to predict the average number of runs given up per inning pitched (R/IP) given the average number of strikeouts per inning pitched (SO/1P) and the average number of home runs per inning pitched (HR/1P) (to 3 decimals). R/IP = +| 30/11D + HR/IP a. Use the F test to determine the overall signicance of the relationship. Compute F test statistic (to 2 decimals). :1 The pvalue is C] (to 3 decimals). What is your conclusion at the .05 level of significance? There a signicant overall relationship. b. Use the ttest to determine the signicance of each independent variable. Compute the t test statistic for the significance of SO/IP (to 2 decimals). :1 The pvalue is C] (to 3 decimals). What is your conclusion at the .05 level of significance? SO/IP significant. Compute the t test statistic for the significance of HR/IP (to 2 decimals). :1 The pvalue is C] (to 3 decimals). What is your conclusion at the .05 level of significance? HR/IP signicant. J2 V X V fx A B C D E F G H J K M N O P Q R S 1 Player Team W L ERA SO/IP HR/IP R/IP Verlander, J DET 24 2.39 1.00 0.10 0.29 After reading these instructions delete all text in this shaded area. Beckett, J BOS 13 2.89 0.91 0.11 0.33 Wilson, C TEX 16 7 2.94 0.91 0.06 0.39 Use the XLMiner Analysis ToolPak to conduct your Linear Regression analysis. Sabathia, C NYY 19 8 3.00 0.97 0.06 0.37 LOO VOULAWN Haren, D LAA 16 10 3.16 0.80 0.07 0.37 After deleting all text in this shaded area, set the output range in the ToolPak to the top left cell of this area (J2). Mccarthy, B OAK 9 9 3.32 0.72 0.06 0.43 Santana, E LAA 11 12 3.37 0.78 0.10 0.41 Your Linear Regression analysis output should fit into this shaded area. Lester, J BOS 15 9 3.47 0.94 0.10 0.39 10 Hernandez, F SEA 14 14 3.47 0.95 0.08 0.42 11 Buehrle, M CWS 13 9 3.58 0.53 0.10 0.45 12 Pineda, M SEA 9 10 3.74 1.00 0.11 0.43 13 Colon, B NYY 8 10 4.00 0.82 0.12 0.51 14 Tomlin, J CLE 12 7 4.24 0.54 0.14 0.48 15 Pavano, C MIN 9 13 4.30 0.45 0.09 0.54 16 Danks, J CWS 8 12 4.32 0.79 0.1 0.51 17 Guthrie, J BAL 9 17 4.32 0.62 0.12 0.53 18 Lewis, C TEX 14 10 4.40 0.83 0.16 0.50 Scherzer, M DET 15 9 4.43 0.89 0.15 0.52 20 Davis, W TB 11 10 4.44 0.57 0.12 0.51 21 Porcello, R DET 14 9 4.75 0.56 0.10 0.57 22 23 24 25 26 27 28 29 30 31 32 33 34 = & Data +
Step by Step Solution
There are 3 Steps involved in it

Get step-by-step solutions from verified subject matter experts