

Question: I need help analyzing and computing the data found in the attached spreadsheet. (10.2 A1) The U.S. Department of Transportation provides the number of miles
I need help analyzing and computing the data found in the attached spreadsheet. (10.2 A1)
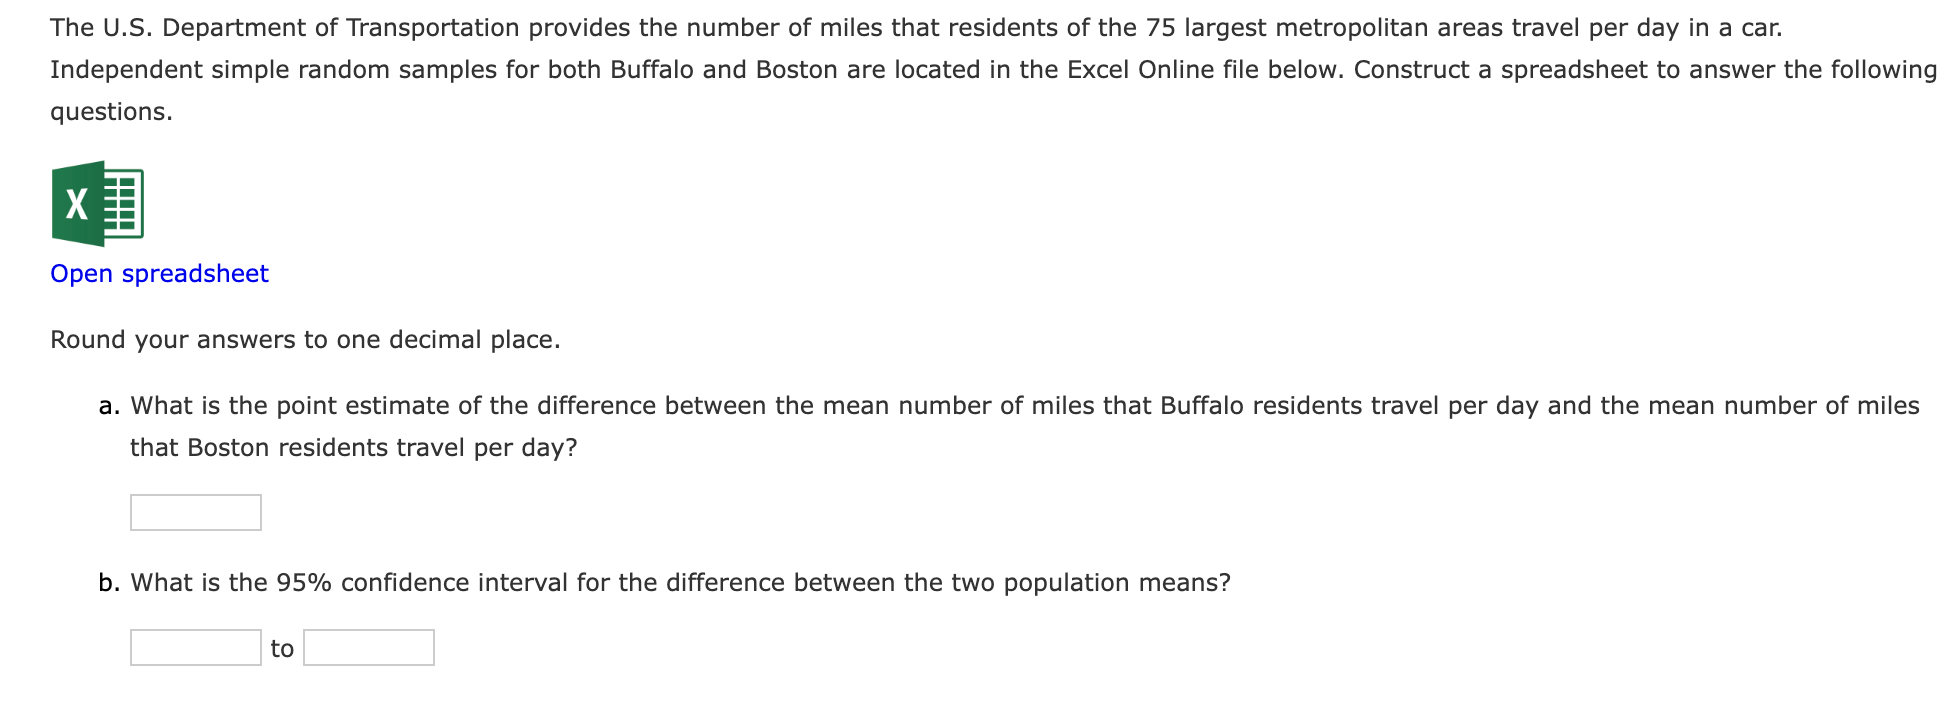
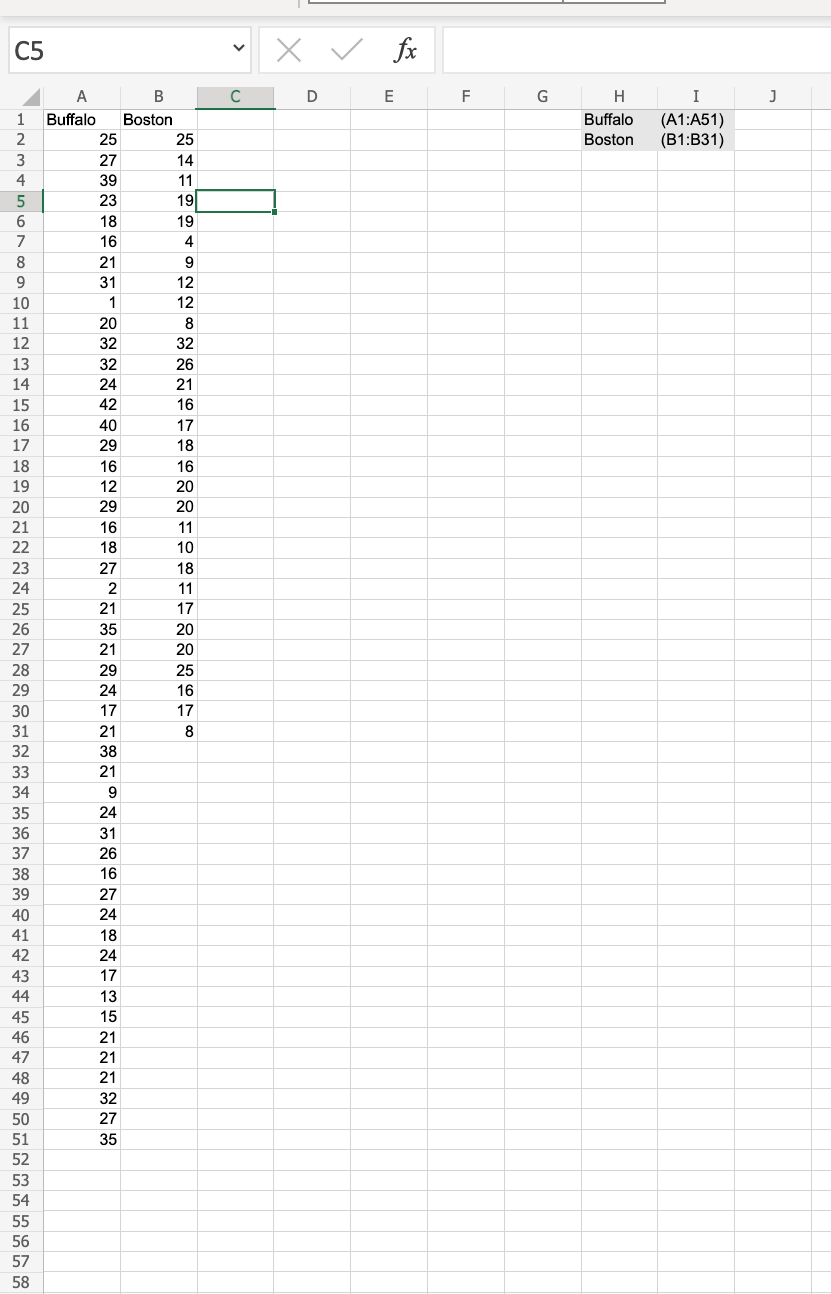
The U.S. Department of Transportation provides the number of miles that residents of the 75 largest metropolitan areas travel per day in a car. Independent simple random samples for both Buffalo and Boston are located in the Excel Online le below. Construct a spreadsheet to answer the following questions. Open spreadsheet Round your answers to one decimal place. a. What is the point estimate of the difference between the mean number of miles that Buffalo residents travel per day and the mean number of miles that Boston residents travel per day? b. What is the 95% condence interval for the difference between the two population means? to
Step by Step Solution
There are 3 Steps involved in it

Get step-by-step solutions from verified subject matter experts