

Question: I need help answering and understanding problem 3. Thank you! 3 Distribution Detective Suppose you have been observing the Mos Eisley Cantina for a few
I need help answering and understanding problem 3. Thank you!
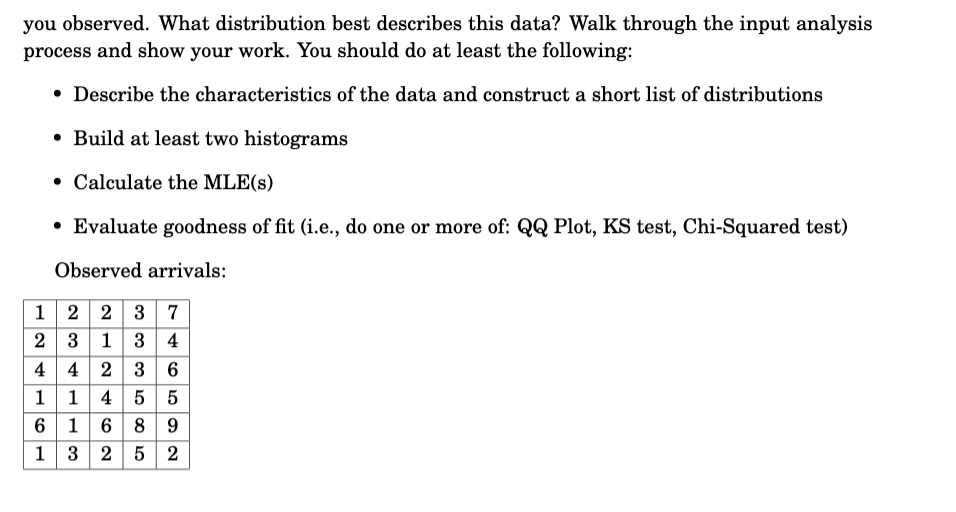
3 Distribution Detective Suppose you have been observing the Mos Eisley Cantina for a few days. You would like to know how many customers arrive per hour during the busiest part of the day. You've made a set of 30 observations, representing how many customers arrived during each hour you observed. What distribution best describes this data? Walk through the input analysis process and show your work. You should do at least the following: 0 Describe the characteristics of the data and construct a short list of distributions 0 Build at least two histograms ' Calculate the MLE(s) ' Evaluate goodness of t (i.e., do one or more of: QQ Plot, KS test, Chi-Squared test) Observed arrivals
Step by Step Solution
There are 3 Steps involved in it

Get step-by-step solutions from verified subject matter experts