

Question: I need help answering this question using MATLAB with simple commands not advanced Problem 6 After the winter break, 3 students came to school sick
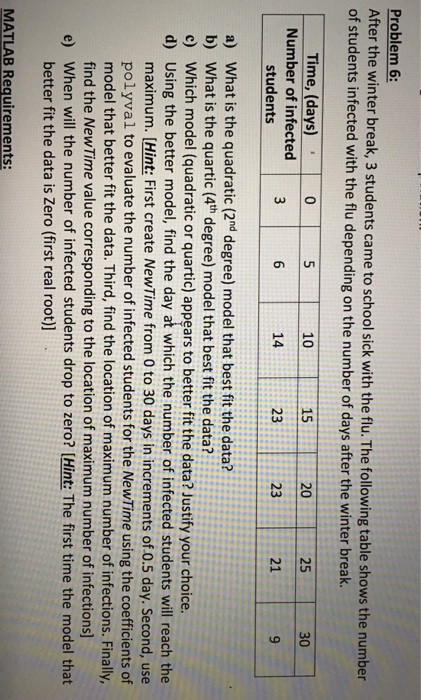
Problem 6 After the winter break, 3 students came to school sick with the The following table shows the number of students infected with the flu depending on the number of days after the winter break Time, (days) 0 5 10 15 20 25 Number of infected 14 23 students a) What is the quadratic (2nd degree) model that best fit the data? b) What is the quartic (4th degree) model that best fit the data? c) Which model (quadratic or quartic) appears to better fit the data? Justify your choice. d) Using the better model, find the day at which the number of infected students will reach the maximum. [Hint: First create NewTime from 0 to 30 days in increments of 0.5 day. Second, use polyval to evaluate the number of infected students for the NewTime using the coefficients of model that better fit the data. Third, find the location of maximum number of infections. Finally, find the NewTime value corresponding to the location of maximum number of infections] e) When will the number of infected students drop to zero? [Hint: The first time the model that better fit the data is Zero (first real root)] MATLAB Requirements
Step by Step Solution
There are 3 Steps involved in it

Get step-by-step solutions from verified subject matter experts