

Question: I need help ASAP, please! I need to have step-by-step solutions. And to help, here are the answers from the book. I thank you with
I need help ASAP, please! I need to have step-by-step solutions. And to help, here are the answers from the book. I thank you with all my heart! They can be done in Microsoft Word or by hand.
- The two separate peaks could reflect a bimodal distribution.
- The second histogram appears unimodal but with a wide peak.
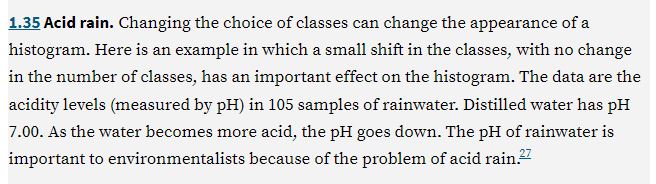
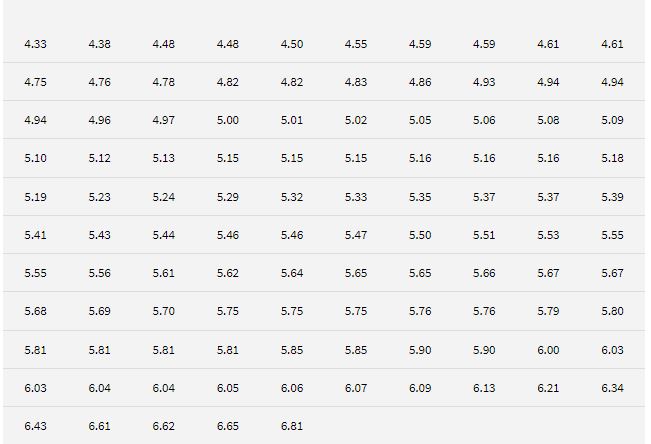
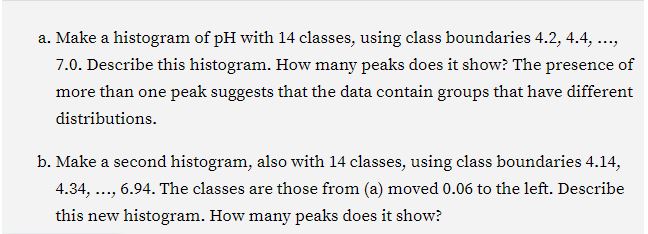
EACH rain. Changing the choice of classes can change the appearance of a histogram. Here is an example in which a small shift in the classes: with no change in the number of classes, has an important effect on the histogram. The data are the acidity levels (measured by pH) in 1G5 samples of rainwater. Distilled water has pH the. As the water becomes more acid , the pH goes down. The pH of rainwater is important to env'uonmentah'sts because of the problem of acid rain. \fa. Make a histogram of pH with 14 classes, using class boundaries 4-2, 4.4, ..., It]- Describe this histogranl. How many peaks does it show? The presence of more than one peak suggests that the data contain groups that have different distributions. in. Make a second histogram, also with 14 classes1 using class boundaries 4.14'7 4.34, ...J 6.94. The classes are those from {a} moved (106 to the left. Describe this new histogram. Ho's;r many peaks does it show
Step by Step Solution
There are 3 Steps involved in it

Get step-by-step solutions from verified subject matter experts