Question: I need help coming up with the pro format statements for level production (Income statement, Balance sheet, and cash flow statement). I tired to upload
I need help coming up with the pro format statements for level production (Income statement, Balance sheet, and cash flow statement). I tired to upload the excel document. It is for the PolarSports Inc. case, if that helps.
Here are pictures:
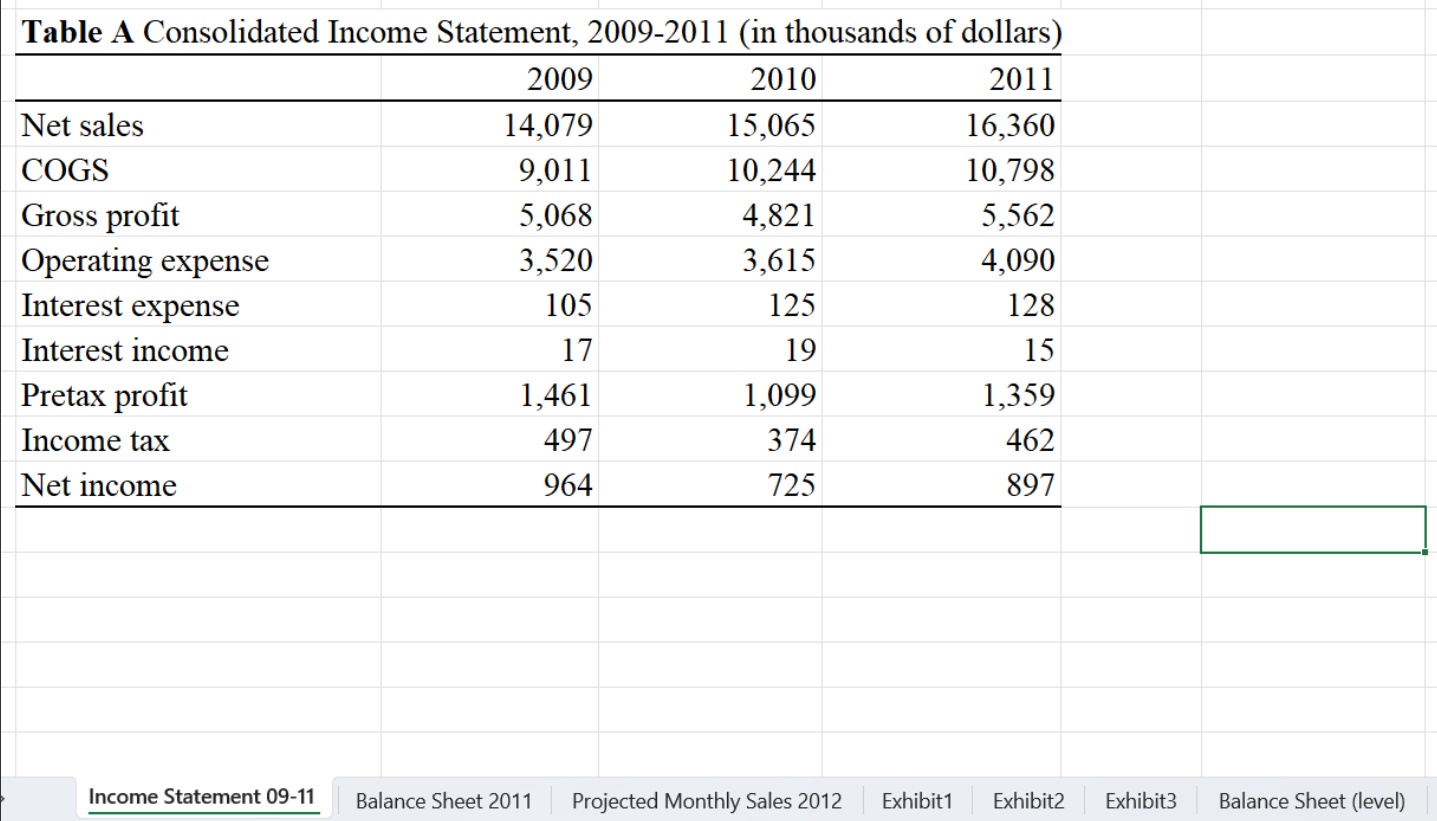
This is the income statement from the years 2009 -2011.
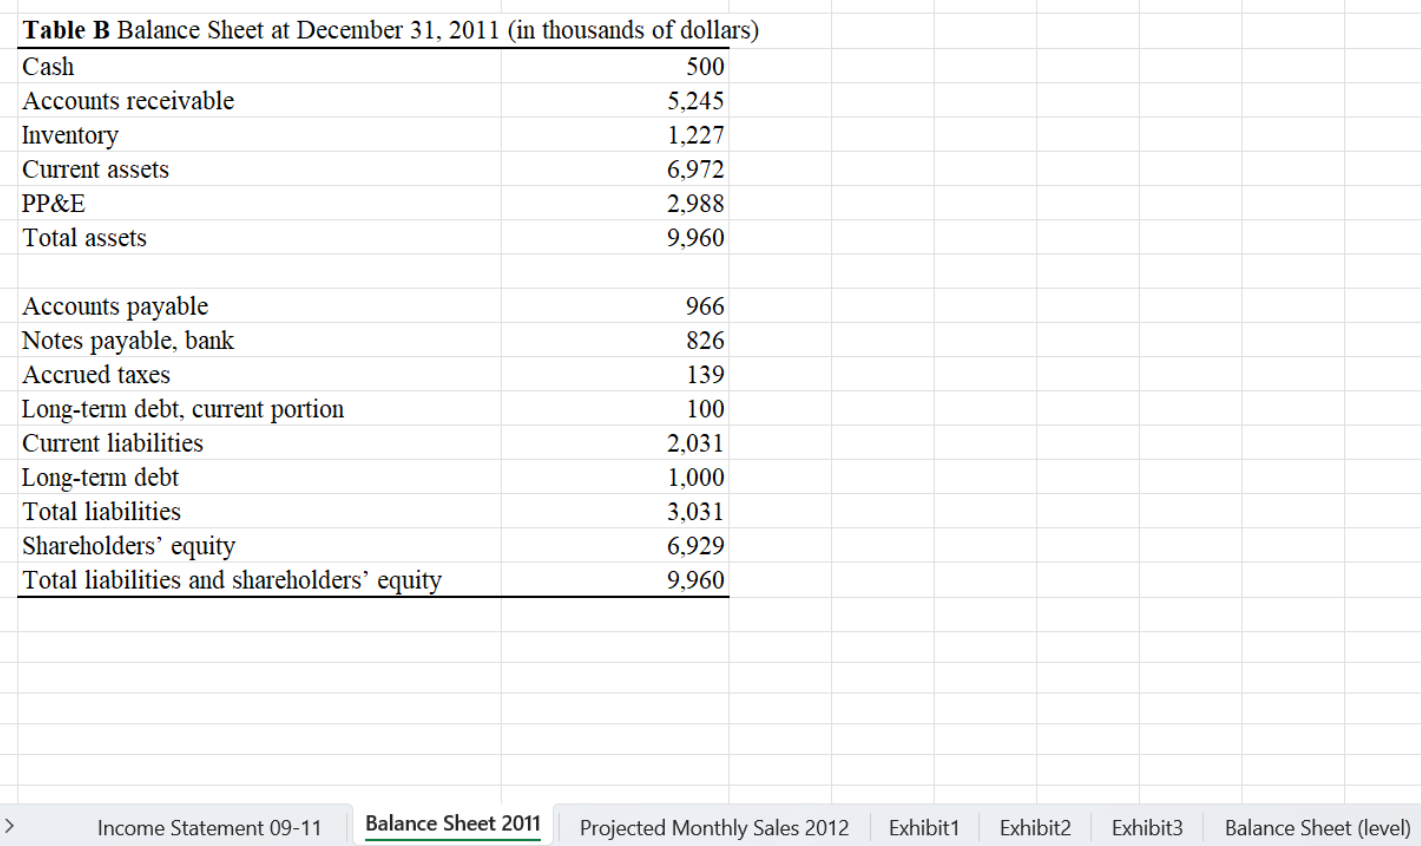
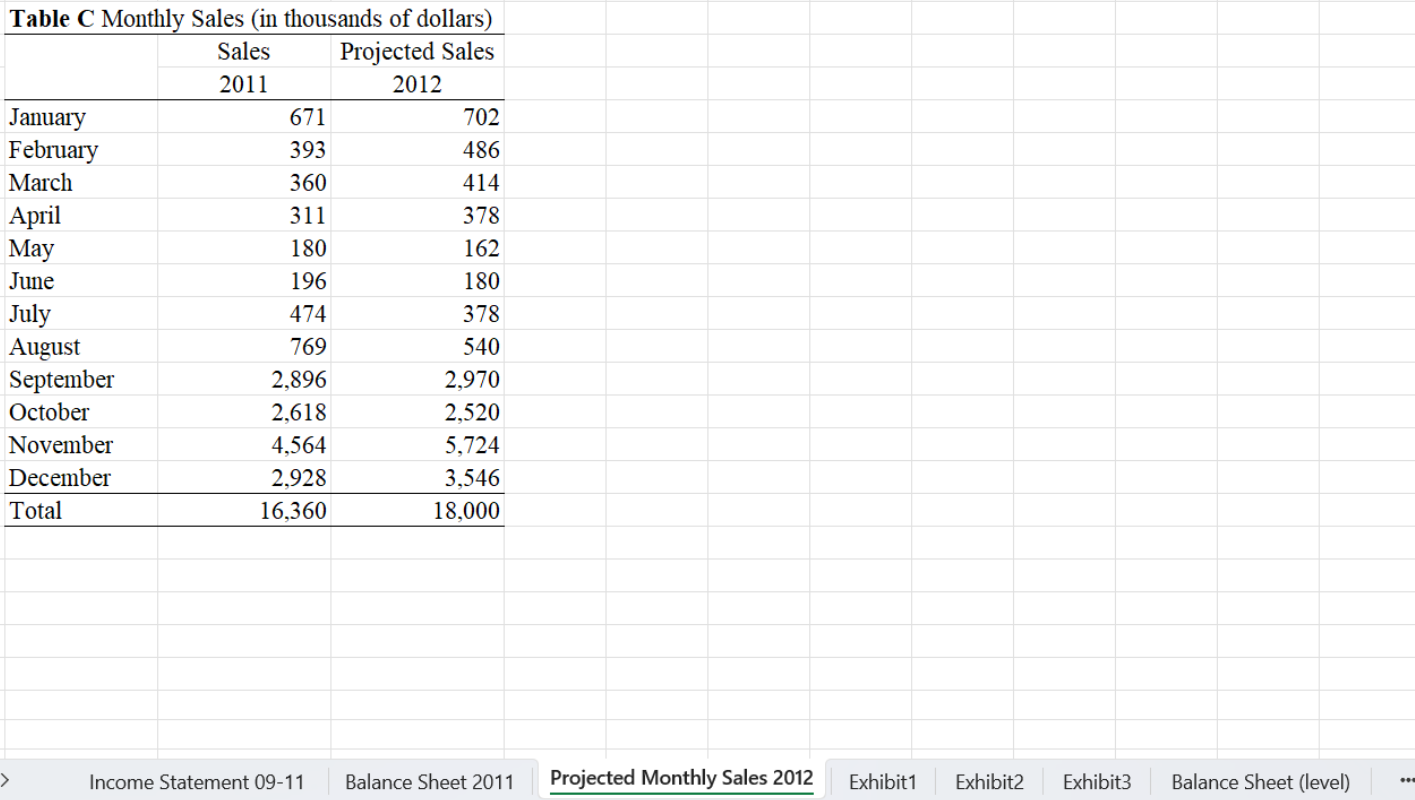
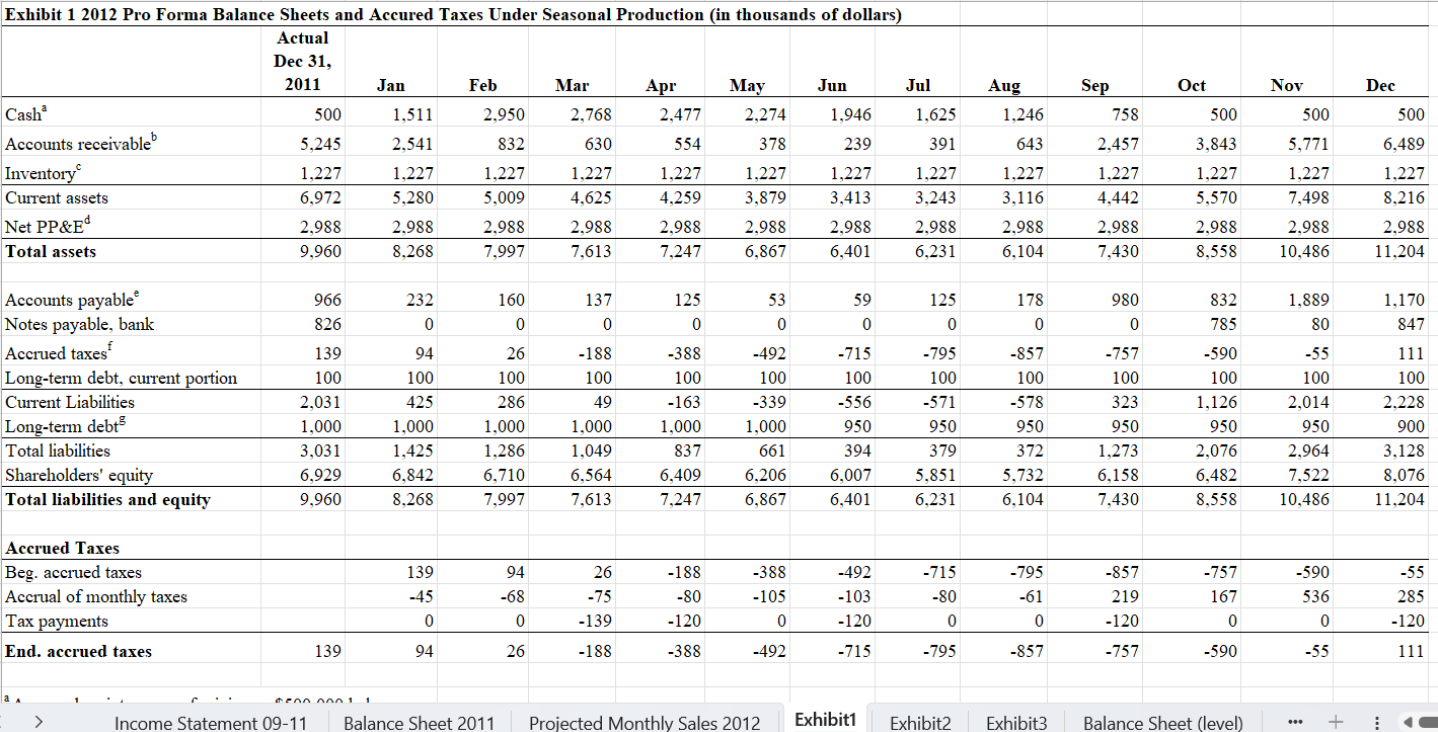
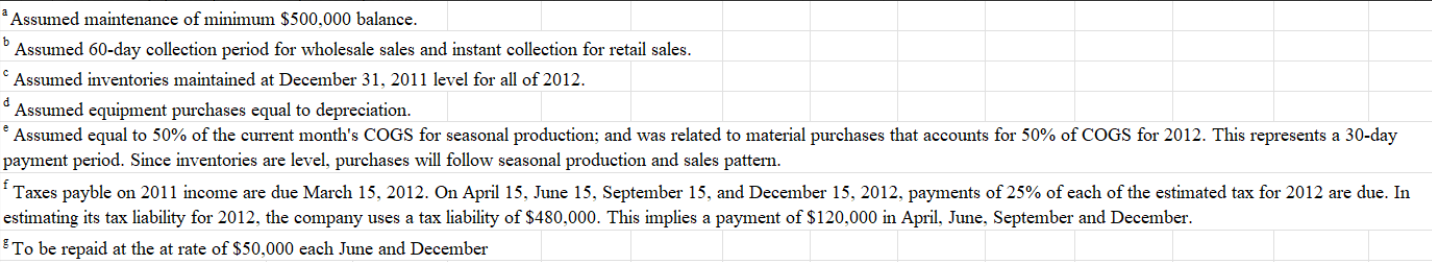
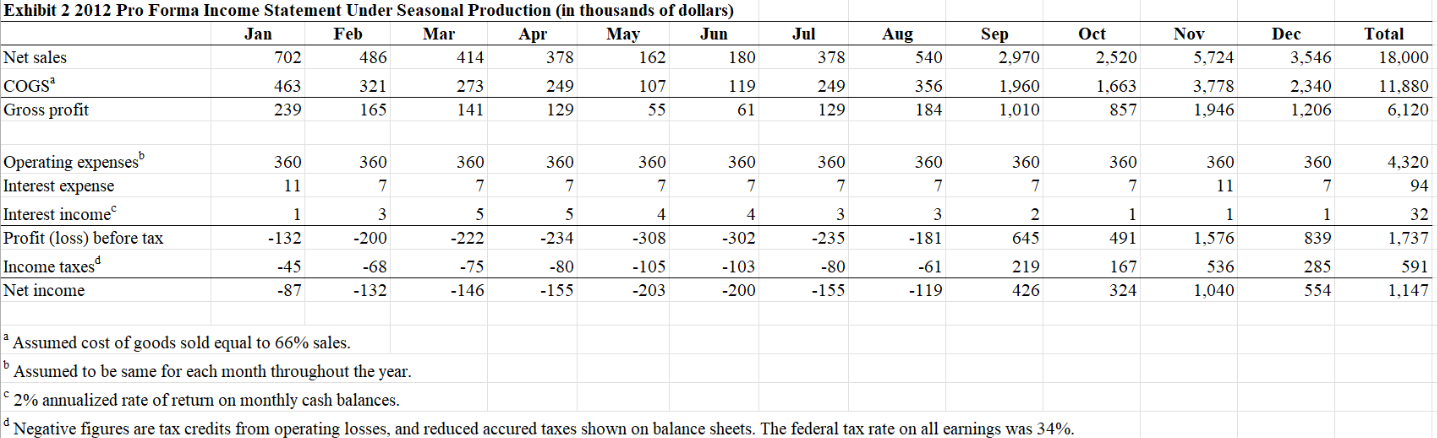
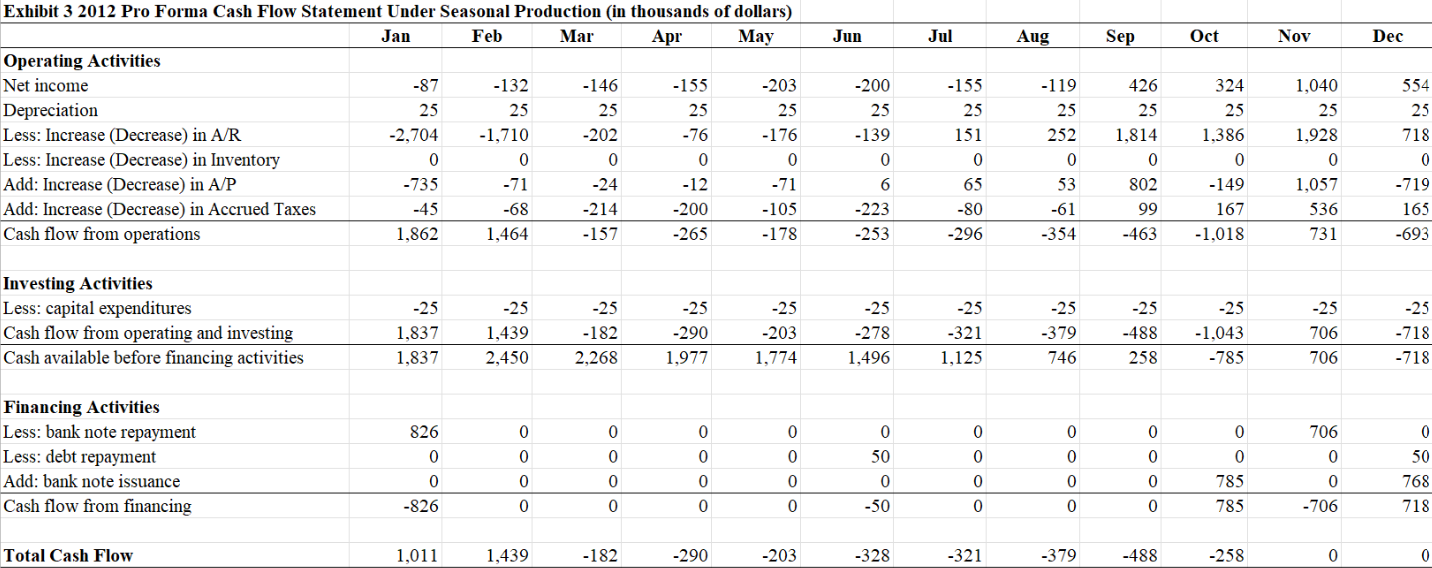
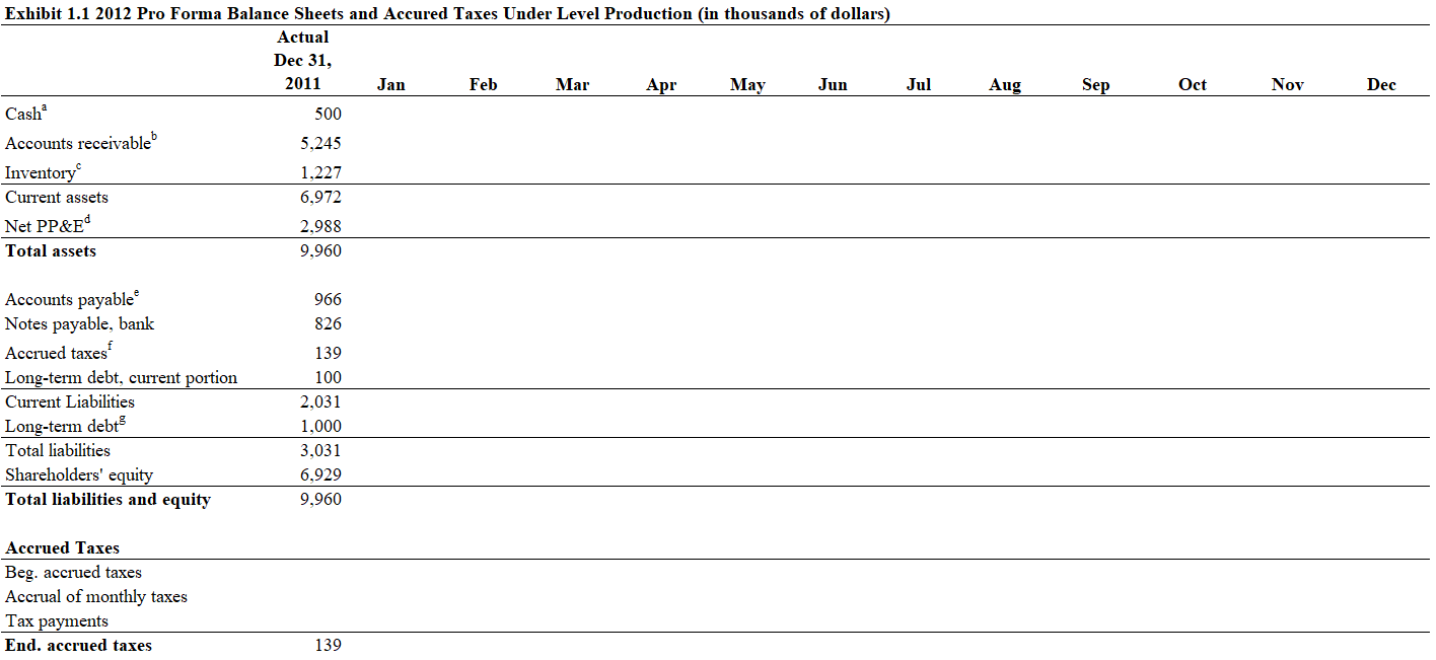
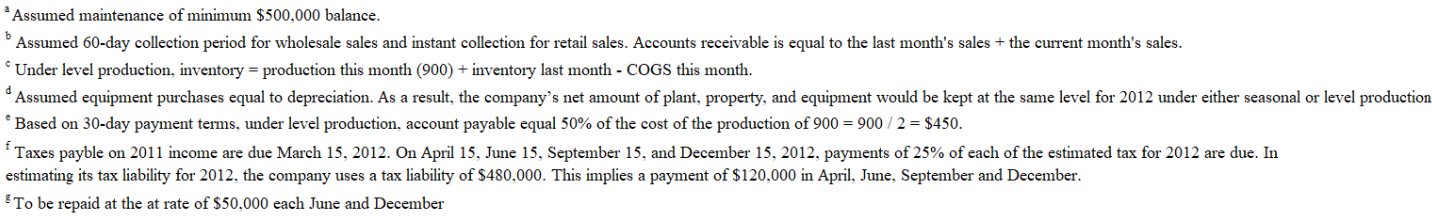
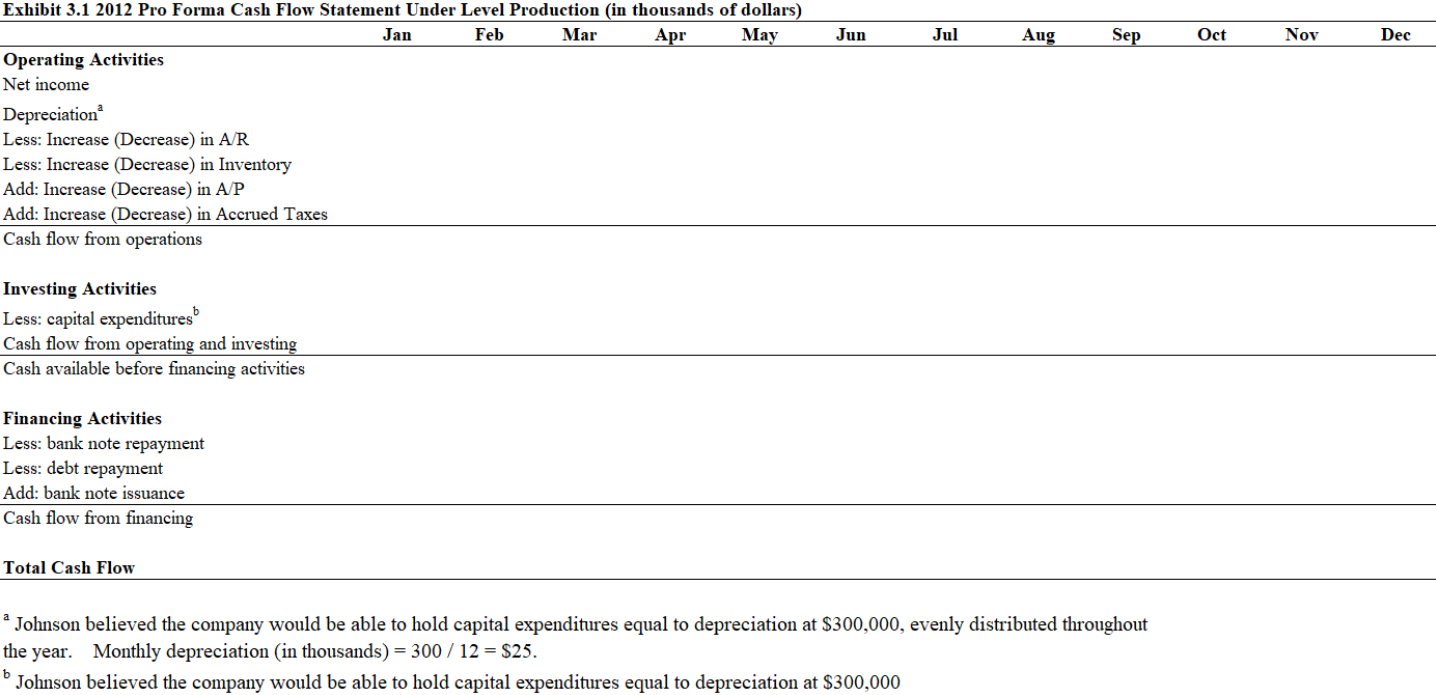
Table A Consolidated Income Statement, 2009-2011 (in thousands of dollars) Net sales COGS Gross profit Operating expense Interest expense Interest income Pretax profit Income tax Net income Income Statement 09-11 2009 2010 14,079 15,065 9,011 10,244 5,068 4,821 3,520 3,615 105 125 17 19 1,461 1,099 497 374 964 725 Balance Sheet 2011 Projected Monthly Sales 2012 2011 16,360 10,798 5.562 4,090 128 15 1,359 462 897 Exhibit1 Exhibit2 Exhibit3 Balance Sheet (level) Table B Balance Sheet at December 31, 2011 (in thousands of dollars) Cash 500 Accounts receivable 5,245 Inventory 1,227 Current assets 6.972 PP&E 2.988 Total assets 9.960 Accounts payable 966 Notes payable, bank 826 Accrued taxes 139 Long-term debt, current portion 100 Current liabilities 2.031 Long-term debt 1.000 Total liabilities 3.031 Shareholders equity 6,929 Total liabilities and shareholders' equity 9.960 Income Statement 09-11 Balance Sheet 2011 Projected Monthly Sales 2012 Exhibit1 Exhibit2 Exhibit3 Balance Sheet (level) Table C Monthly Sales (in thousands of dollars) Sales Projected Sales 2011 2012 January 671 702 February 393 486 March 360 414 April 311 378 May 180 162 June 196 180 July 474 378 August 769 540 September 2,896 2,970 October 2,618 2,520 November 4,564 5,724 December 2,928 3,546 Total 16,360 18,000 Income Statement 09-11 Balance Sheet 2011 Projected Monthly Sales 2012 Exhibit1 Exhibit2 Exhibit3 Balance Sheet (level) ..Exhibit 1 2012 Pro Forma Balance Sheets and Accured Taxes Under Seasonal Production (in thousands of dollars) Actual Dec 31, 2011 Jan Feb Mar Apr May Jun Jul Aug Sep Oct Nov Dec Cash 500 1,511 2,950 2,768 2,477 2,274 1,946 1,625 1,246 758 500 500 500 Accounts receivable 5,245 2,541 832 630 554 378 239 391 643 2,457 3,843 5,771 6.489 Inventory 1,227 1,227 1,227 1,227 1,227 1,227 1,227 1,227 1,227 1,227 1,227 Current assets 1,227 1,227 6,972 5,280 5.009 4.625 4.259 3,879 3,413 3,243 3,116 4.442 5,570 7.498 8,216 Net PP&E 2,988 2,988 2.988 2.988 2,988 2,988 2,988 2,988 2,988 2,988 2,988 Total assets 2,988 2,988 9,960 8,268 7,997 7,613 7,247 6,867 6,401 6,231 6,104 7,430 8,558 10,486 11,204 Accounts payable 966 232 160 137 125 53 59 125 178 980 Notes payable, bank 832 1,889 1,170 826 0 0 0 0 0 0 0 0 0 785 80 847 Accrued taxes 139 94 26 -188 -388 -492 -715 -795 -857 -757 -590 -55 Long-term debt, current portion 111 100 100 100 100 100 100 100 100 100 100 100 100 Current Liabilities 100 2,031 425 286 49 -163 339 -556 -571 -578 323 Long-term debt- 1,126 2,014 1,000 2,228 1,000 1,000 1,000 1,000 1,000 950 950 950 950 Total liabilities 950 950 900 3,031 1,425 1,286 1,049 837 661 394 379 372 1,273 Shareholders' equity 2,076 2,964 3,128 6,929 6,842 6,710 6.564 6,409 6,206 6.007 5,851 5,732 6,158 6,482 Total liabilities and equity 7,522 8,076 9,960 8,268 7,997 7,613 7,247 6,867 6,401 6.231 6,104 7,430 8,558 10,486 11,204 Accrued Taxes Beg. accrued taxes 139 94 26 -188 -388 -492 -715 -795 -857 -757 Accrual of monthly taxes -590 -55 -45 -68 -75 -80 -105 -103 -80 -61 219 167 536 285 Tax payments 0 0 -139 -120 0 -120 0 0 -120 0 0 -120 End. accrued taxes 139 94 26 -188 -388 -492 -715 -795 -857 -757 -590 -55 111 Income Statement 09-11 Balance Sheet 2011 Projected Monthly Sales 2012 Exhibit1 Exhibit2 Exhibit3 Balance Sheet (level) ... +"Assumed maintenance of minimum $500,000 balance. Assumed 60-day collection period for wholesale sales and instant collection for retail sales. "Assumed inventories maintained at December 31, 2011 level for all of 2012. "Assumed equipment purchases equal to depreciation. Assumed equal to 50% of the current month's COGS for seasonal production; and was related to material purchases that accounts for 50% of COGS for 2012. This represents a 30-day payment period. Since inventories are level, purchases will follow seasonal production and sales pattern. Taxes payble on 2011 income are due March 15, 2012. On April 15, June 15, September 15, and December 15, 2012, payments of 25% of each of the estimated tax for 2012 are due. In estimating its tax liability for 2012, the company uses a tax liability of $480,000. This implies a payment of $120,000 in April, June, September and December. To be repaid at the at rate of $50,000 each June and DecemberExhibit 2 2012 Pro Forma Income Statement Under Seasonal Production (in thousands of dollars) Jan Feb Mar Apr May Jun Jul Aug Sep Oct Nov Dec Total Net sales 702 486 414 378 162 180 378 540 2,970 2,520 5.724 3,546 18,000 coGs* 463 321 273 249 107 119 249 356 1.960 1.663 3,778 2,340 11.880 Gross profit 239 165 141 129 55 61 129 184 1,010 857 1.946 1,206 6,120 Operating expenses\" 360 360 360 360 360 360 360 360 360 360 360 360 4.320 Interest expense 11 7 T 7 7 7 7 T 7 7 11 7 94 Interest income 1 3 5 4 4 3 3 2 1 1 1 32 Profit (loss) before tax -132 =200 -222 =234 -308 =302 =235 -181 645 491 1.576 839 1,737 Income taxes -45 -68 -75 -80 -105 -103 -80 -61 219 167 536 285 391 Net income -87 -132 -146 -155 -203 -200 -155 -119 426 324 1.040 554 1.147 * Assumed cost of goods sold equal to 66% sales. " Assumed to be same for each month throughout the year. 2% annualized rate of return on monthly cash balances. d Negative figures are tax credits from operating losses, and reduced accured taxes shown on balance sheets. The federal tax rate on all earnings was 34%. Exhibit 3 2012 Pro Forma Cash Flow Statement Under Seasonal Production (in thousands of dollars) Jan Feb Mar Apr May Jun Jul Aung Sep Oct Nov Dec Operating Activities Net income -87 -132 -146 -155 -203 -200 -155 -119 426 324 1.040 554 Depreciation 25 25 25 25 25 25 23 25 25 25 25 25 Less: Increase (Decrease) in A/R -2,704 -1,710 =202 -76 -176 -139 151 252 1.814 1.386 1,928 718 Less: Increase (Decrease) in Inventory 0 Q 0 0 0 0 0 0 0 0 0 0 Add: Increase (Decrease) in A/P -735 =71 -24 -12 -71 6 65 53 802 -149 1.057 -719 Add: Increase (Decrease) in Accrued Taxes -45 -68 -214 -200 -105 -223 -80 -61 99 167 536 165 Cash flow from operations 1.862 1.464 -157 =265 -178 -253 -296 -354 -463 -1.018 731 -693 Investing Activities Less: capital expenditures -25 -25 -25 -25 -25 -25 -25 -25 -25 -25 -25 -25 Cash flow from operating and investing 1,837 1.439 -182 -290 -203 -278 -321 -379 -488 -1.043 706 =718 Cash available before financing activities 1.837 2.450 2,268 1.977 1,774 1.496 1,125 746 258 -785 706 -718 Financing Activities Less: bank note repayment 826 0 0 0 0 0 0 0 0 0 706 0 Less: debt repayment 0 0 0 0 0 50 0 0 0 0 0 50 Add: bank note issuance 0 0 0 0 0 0 0 0 0 785 0 768 Cash flow from financing -826 0 0 0 0 -50 0 0 0 785 -706 718 Total Cash Flow 1.011 1.439 -182 -290 -203 -328 -321 -379 -488 -258 0 0 Exhibit 1.1 2012 Pro Forma Balance Sheets and Accured Taxes Under Level Production (in thousands of dollars) Actual Dec 31, 2011 Jan Feb Mar Apr May Jun Jul Aug Sep Oct Nov Dec Cash 500 Accounts receivable 5.245 Inventory 1,227 Current assets 6,972 Net PP&E 2,988 Total assets 9,960 Accounts payable 966 Notes payable, bank 826 Accrued taxes 139 Long-term debt, current portion 100 Current Liabilities 2,031 Long-term debt 1,000 Total liabilities 3.031 Shareholders' equity 6.929 Total liabilities and equity 9,960 Accrued Taxes Beg. accrued taxes Accrual of monthly taxes Tax payments End. accrued taxes 139* Assumed maintenance of minimum $500,000 balance. Assumed 60-day collection period for wholesale sales and instant collection for retail sales. Accounts receivable is equal to the last month's sales + the current month's sales. Under level production. inventory = production this month (900) + inventory last month - COGS this month. Assumed equipment purchases equal to depreciation. As a result, the company's net amount of plant, property, and equipment would be kept at the same level for 2012 under either seasonal or level production * Based on 30-day payment terms. under level production. account payable equal 50% of the cost of the production of 900 = 900 / 2 = $450. f Taxes payble on 2011 income are due March 15. 2012. On April 15. June 15. September 15. and December 15. 2012, payments of 25% of each of the estimated tax for 2012 are due. In estimating its tax liability for 2012, the company uses a tax liability of $480.000. This implies a payment of $120,000 in April, June, September and December., #To be repaid at the at rate of $50,000 each June and December Exhibit 2.1 2012 Pro Forma Income Statement Under Level Production (in thousands of dollars) Jan Feb Mar Apr May Jun Jul Aug Sep Oct Nov Dec Total Net sales COGs* Gross profit Operating expenses\" Interest expense Interest income\" Profit (loss) before tax Income taxes Net income Under level production, assumed cost of goods sold equal to 60% sales. B Operating expenses. projected to be 24% of sales, would be incurred evenly throughout each month of 2012 under either seasonal or level production. The average interest rate Polar paid on its line of credit was 6% in 2011. Any withdrawal in excess of $2 million would be subject to 11% interest. The long-term bond carried a coupon 4 29% annualized rate of return on monthly cash balances. Negative figures are tax credits from operating losses, and reduced accured taxes shown on balance sheets. The federal tax rate on all earnings was 34%. Exhibit 3.1 2012 Pro Forma Cash Flow Statement Under Level Production (in thousands of dollars) Jan Feb Mar Apr May Jun Jul Au, Se| Oct Nov Dec Operating Activities Net income Depreciation Less: Increase (Decrease) m A/R Less: Increase (Decrease) m Inventory Add: Increase (Decrease) in A/P Add: Increase (Decrease) in Accrued Taxes Cash flow from operations Investing Activities Less: capital expenciimrcsb Cash flow from operating and investing Cash available before financing activities Financing Activities Less: bank note repayment Less: debt repayment Add: bank note issuance Cash flow from financing Total Cash Flow * Johnson believed the company would be able to hold capital expenditures equal to depreciation at $300,000, evenly distributed throughout the year. Monthly depreciation (in thousands) = 300 / 12 = 25. Johnson believed the company would be able to hold capital expenditures equal to depreciation at $300,000
Step by Step Solution
There are 3 Steps involved in it
1 Expert Approved Answer
Step: 1 Unlock
Question Has Been Solved by an Expert!
Get step-by-step solutions from verified subject matter experts
Step: 2 Unlock
Step: 3 Unlock
Students Have Also Explored These Related Accounting Questions!