

Question: I need help completing the financial section. Unable to upload excel so I'm attaching photos. Master Budget Financing needs Decreased by Summary of Expected Financing
I need help completing the financial section. Unable to upload excel so I'm attaching photos.
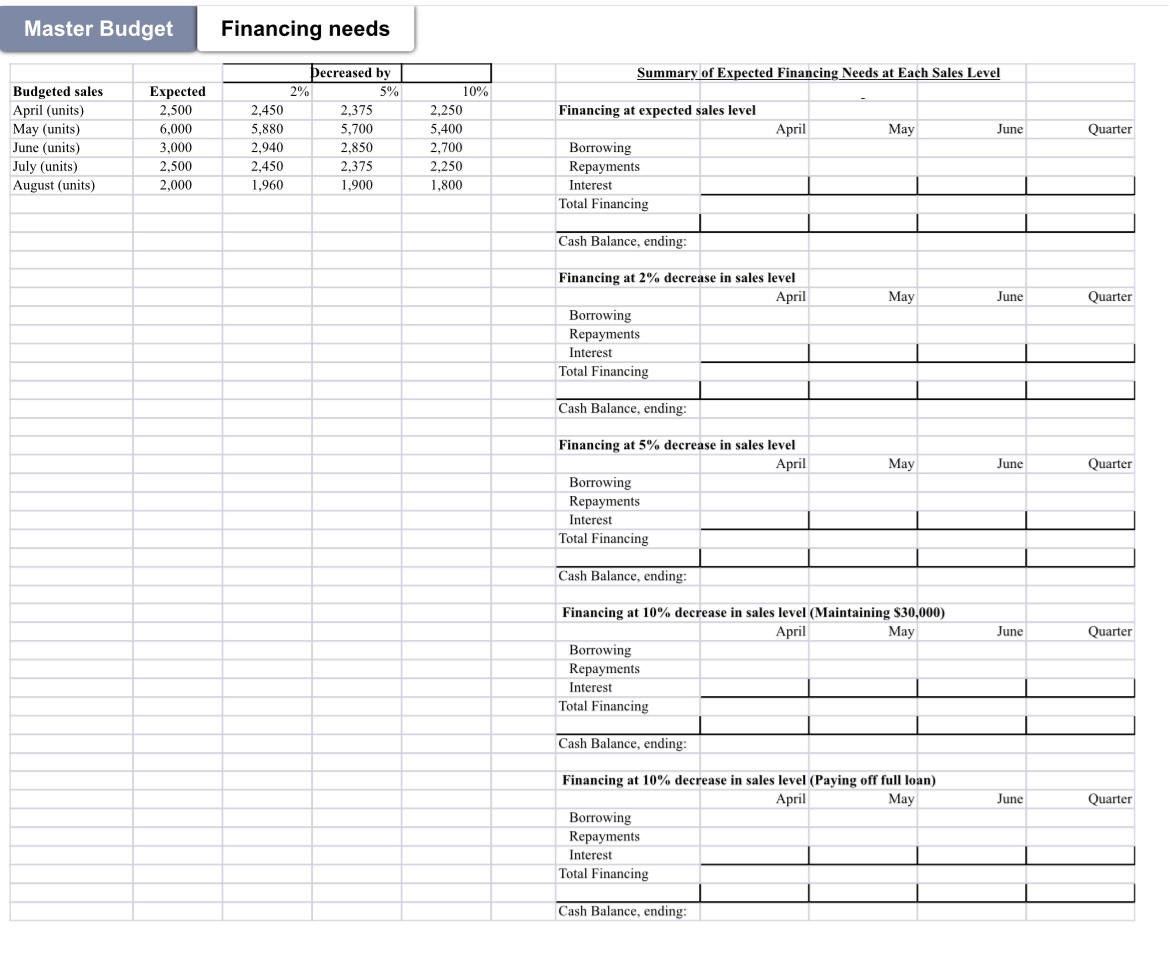
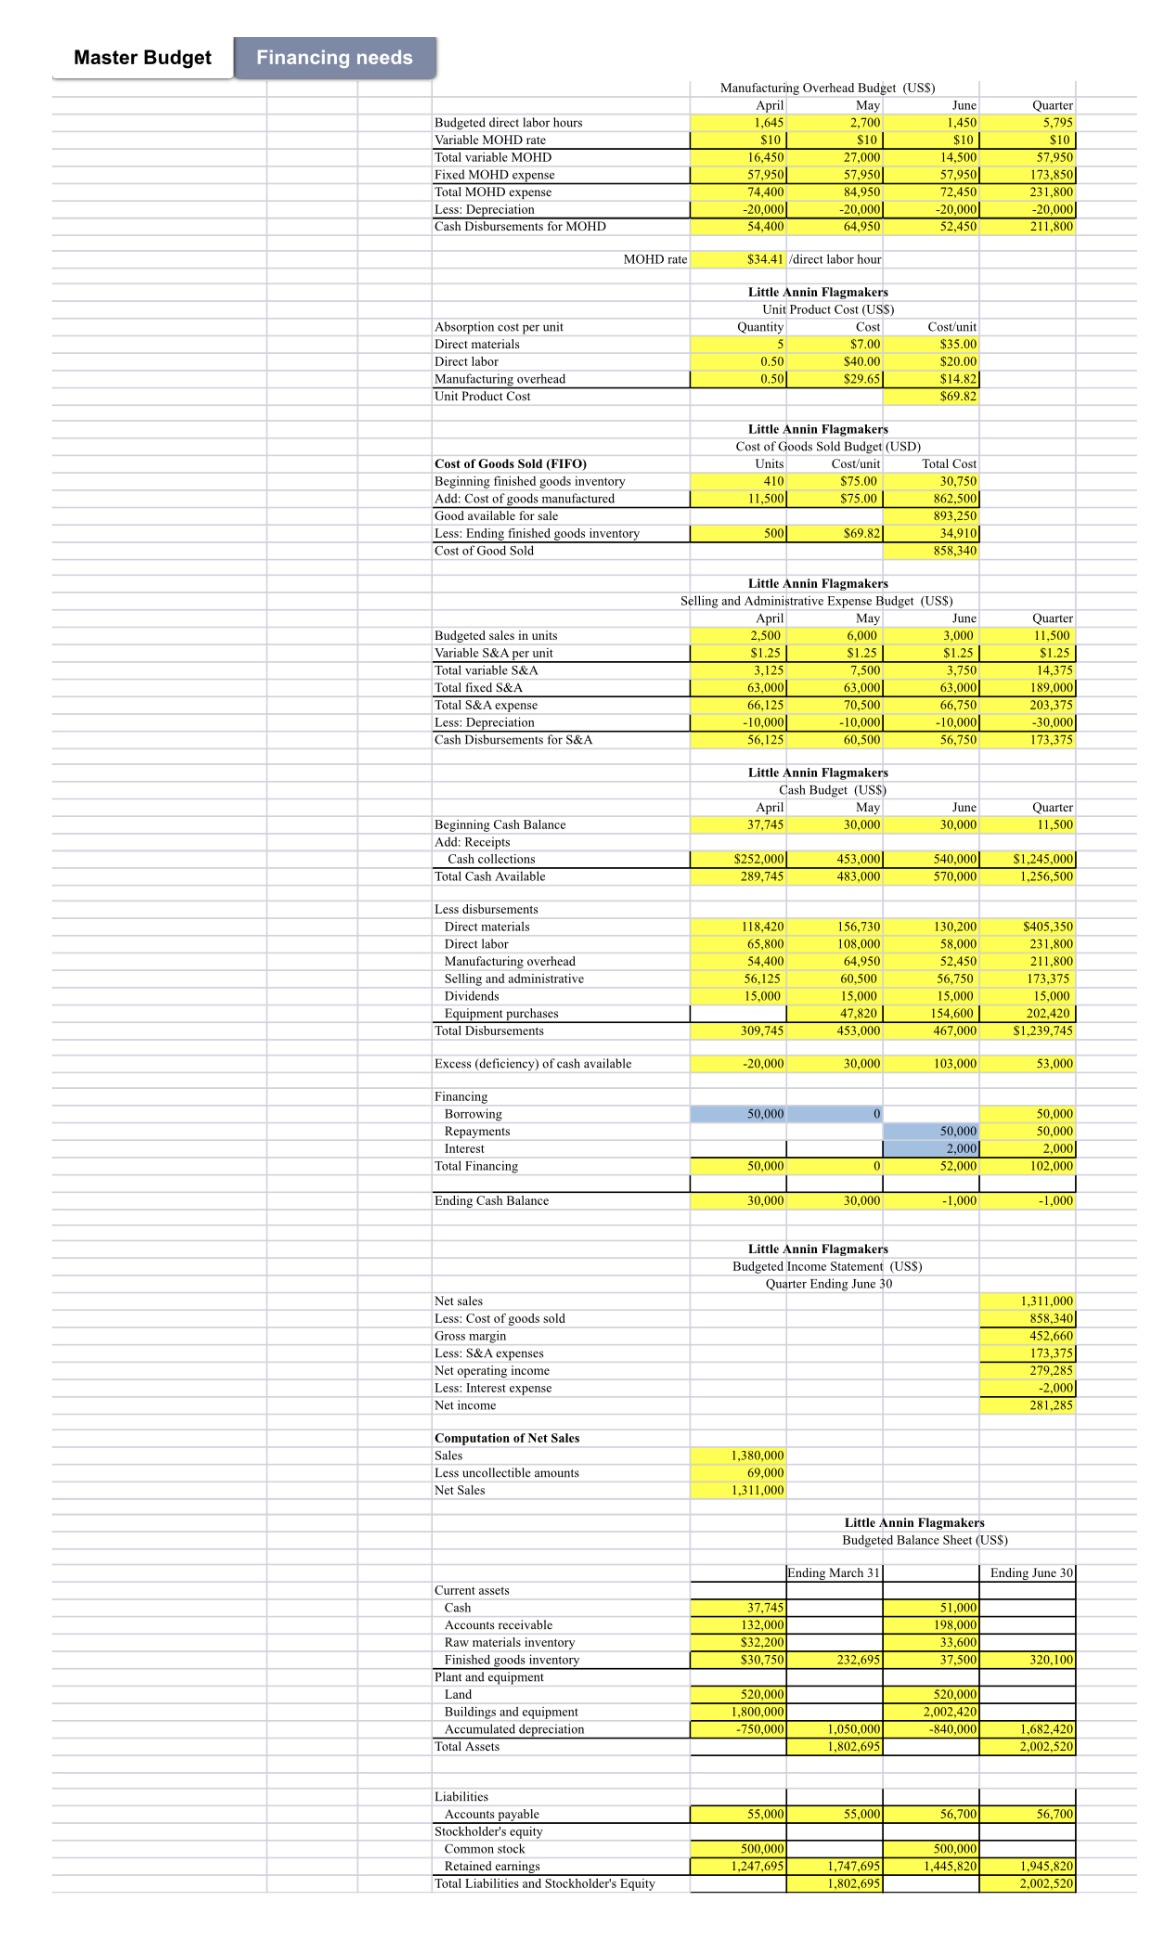
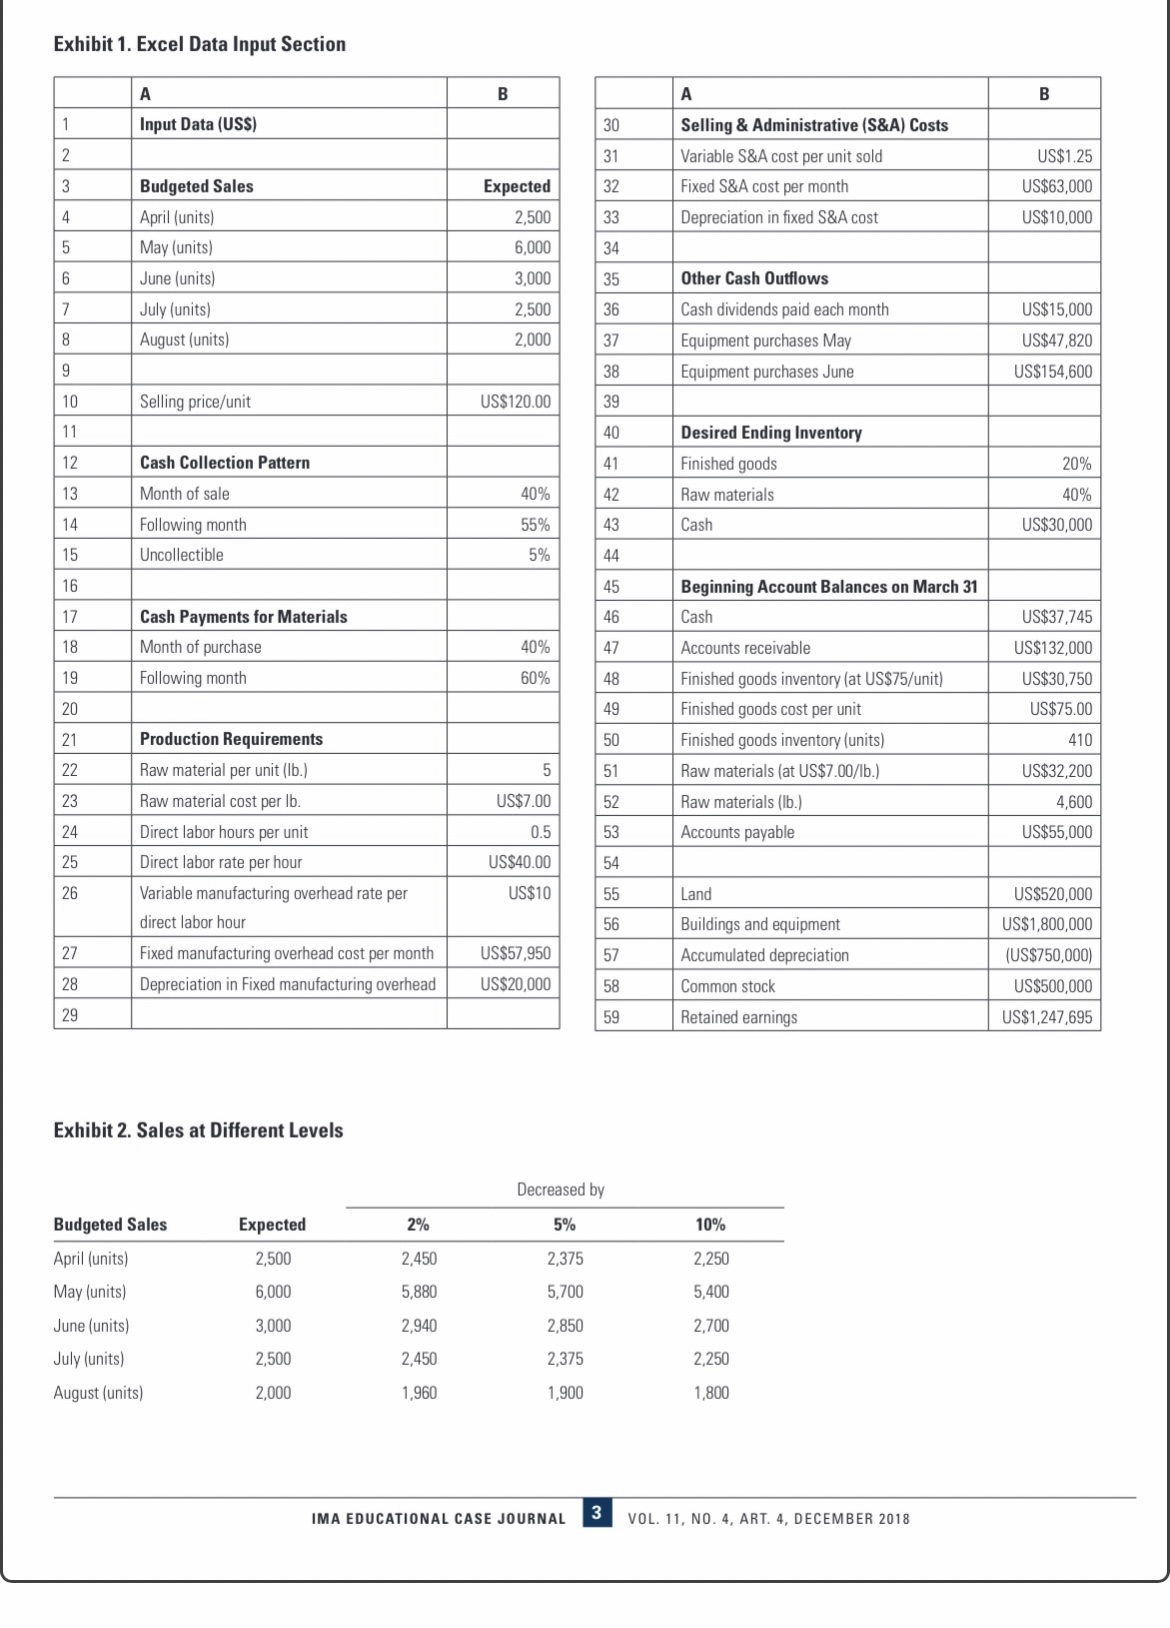
Master Budget Financing needs Decreased by Summary of Expected Financing Needs at Each Sales Level Budgeted sales Expected 2% 5% 10% April (units) 2,500 2,450 2,37 2,250 Financing at expected sales level May (units) 6,000 5,880 5,700 5,400 Apri May June Quarter June (units) 3,000 2,940 2,850 2,70 Borrowing July (units) 2,500 2,450 2.375 2,250 Repayments August (units) 2,000 1,960 1,900 1,800 Interest Total Financing Cash Balance, ending: Financing at 2% decrease in sales level April May June Quarter Borrowing Repayments Interest Total Financing Cash Balance, ending: Financing at 5% decrease in sales level April May June Quarter Borrowing Repayments Interest Total Financing Cash Balance, ending: Financing at 10% decrease in sales level (Maintaining $30,000) April May June Quarter Borrowing Repayments Interest Total Financing Cash Balance, ending: Financing at 10% decrease in sales level (Paying off full loan) April May June Quarter Borrowing Repayments Interest Total Financing Cash Balance, ending:IMA EDUCATIONAL Case The Association of Study ima Accountants and Financial Professionals Case Journal in Business ISSN 1940-204X Cash Is King: Master Budgets to Inform a Credit Decision Anne M.A. Sergeant, GMA, PhD Neal VandenBerg, CPA, PhD Seidman College of Business Seidman College of Business Grand Valley State University Grand Valley State University Grand Rapids, MI Grand Rapids, MI INTRODUCTION As Buford began the work, he recalled his last LOC analysis and how well received it was. He had taken the Early one morning in March, Jordan Buford was preparing information provided by the company and developed master his daily work when his boss, Olivia Anton, approached budgets in Excel that used an input section with numbers him and announced, "Little Annin Flagmakers (LAF) has that could be changed for assessing different scenarios. The submitted an application for a line of credit (LOC) for April committee had specifically asked about the effect of a sales through June. I want you to prepare budgeted financial reduction of 2%, 5%, and 10% on the applicant's cash needs. statements similar to the ones you prepared for our last He wanted to be prepared for these types of questions. LOC applicant. I need this by 3 p.m. today for the 4 p.m. credit committee meeting. Be prepared to make a loan LITTLE ANNIN FLAGMAKERS BACKGROUND recommendation and to address questions from the credit committee. I have cleared your schedule. Let me know if LAF manufactures one product, a large durable 8' x 12' you need anything." American flag, which it sells for US$120. Because of the large Kent Bank is a state bank with multiple branches that size of the flag, this product is not sold in stores; rather it is offers a variety of services for personal and commercial needs. sold through a relatively small number of online retailers. The bank has been serving the local community for more Each quarter, retailers estimate sales for the upcoming five than 110 years and prides itself on its personalized approach months, revising proximate sales as necessary. In general, to provide financial services, local management, long-term the retailers are reasonably good at estimating their sales stability, and a full range of deposit and lending products and needs, but some variation in demand does occur, and the services. Commercial credit decisions at Kent Bank are made retailers expect to be able to adjust orders as needed. LAF by the Commercial Credit Committee, which consists of the allows retailers to adjust each month's purchases to 80% to senior commercial credit analyst and two vice presidents. 120% of the estimated sales levels. Flags are shipped to retail Buford was recently hired by Kent Bank as a commercial customers using JIT distribution so that the online retailers credit analyst to provide analysis for commercial loan do not have to store inventory. applications. During his undergraduate studies, he studied Typical sales for the flag are 1,800 units per month with accounting and finance, and shortly after graduation seasonal increases in April through August. Sales estimates are passed the CMA@ (Certified Management Accountant) 2,500 units in April, 6,000 units in May, 3,000 units in June, 2,500 examination. Buford reports directly to Anton, the senior units in July, and 2,000 units in August. Customers historically commercial credit analyst who has been with Kent Bank for have paid 40% of their purchases in the month of the sale, 55% 10 years. in the following month, and the remaining 5% is uncollectible. IMA EDUCATIONAL CASE JOURNAL VOL. 11, NO. 4, ART. 4, DECEMBER 2018 @2018 IMAMaster Budget Financing needs Manufacturing Overhead Budget (USS) April May June Quarter Budgeted direct labor hours 1,645 2,700 1,450 5.795 Variable MOHD rate $10 $10 $10 $10 Total variable MOHD 16,450 27.000 14,500 57,950 Fixed MOHD expense 57.950 57,950 57,950 173,850 Total MOHD expense 74,400 84,950 72,450 231,800 Less: Depreciation 20,000 20,000 20,000 -20,000 Cash Disbursements for MOHD 54,400 64.950 52,450 211,800 MOHD rate $34.41 /direct labor hour Little Annin Flagmakers Unit Product Cost (USS) Absorption cost per unit Quantity Cost Cost/unit Direct materials S $7.00 $35.00 Direct labor 0.50 $40.00 $20.00 Manufacturing overhead 0.50 $29.65 $14.82 Unit Product Cost $69.82 Little Annin Flagmakers Cost of Goods Sold Budget (USD) Cost of Goods Sold (FIFO) Units Cost/unit Total Cost Beginning finished goods inventory 410 $75.00 30,750 Add: Cost of goods manufactured 11,500 $75.00 362,500 Good available for sale 93,250 Less: Ending finished goods inventory 500 $69.82 34,910 Cost of Good Sold 858,340 Little Annin Flagmaker's Selling and Administrative Expense Budget (US$) April May June Quarter Budgeted sales in units 2,500 6,000 3,000 11,500 Variable S&A per unit $1.25 $1.25 $1.25 $1.25 Total variable S&A 3,125 7,500 3,750 14,375 Total fixed S&A 63,000 63,000 63,000 189,000 Total S&A expense 66, 125 70,500 66,750 203,375 Less: Depreciation 10,000 10,000 10,000 -30,000 Cash Disbursements for S&A 56,125 60.500 56,750 173,375 Little Annin Flagmaker's Cash Budget (US$) April May June Quarter Beginning Cash Balance 37,745 30,000 30,000 11,500 Add: Receipts Cash collections $252,000 453,000 540,000 $1.245.000 Total Cash Available 289,745 483,000 $70,000 1,256,500 Less disbursement Direct materials 18,420 156,730 130,200 $405,350 Direct labor 65,800 108,000 58,000 231,800 Manufacturing overhead 54,400 64,950 $2,450 211,800 Selling and administrative 56,125 60,500 56,750 173,375 Dividend 15,000 15,000 15,000 15,000 Equipment purchases 47,820 54,600 202,420 Total Disbursements 309,745 453,000 467,000 $1,239,745 Excess (deficiency) of cash available -20,000 30,000 103,000 53,000 Financing Borrowing 50,000 50,000 Repayments 50,000 50,000 Interest 2,000 2,000 Total Financing 50,000 $2,000 102,000 Ending Cash Balance 30,000 30,000 -1,000 -1,000 Little Annin Flagmakers Budgeted Income Statement (USS) Quarter Ending June 30 Net sales 1,311,000 Less: Cost of goods sold 858,340 Gross margin 452,660 Less: S&A expenses 173.375 Net operating income 279.285 Less: Interest expense -2,000 Net income 281,285 Computation of Net Sales Sales 1,380,000 Less uncollectible amounts 69,000 Net Sales 1,311,000 Little Annin Flagmakers Budgeted Balance Sheet (US$) Ending March 31 Ending June 30 Current assets Cash 37,745 $1,000 Accounts receivable 32,000 198,000 Raw materials inventory 32,200 33,600 Finished goods inventory $30,750 232,695 37,500 320,100 Plant and equipment Land $20,000 520,000 Buildings and equipment 1,800,000 ,002,420 Accumulated depreciation -750,000 1,050,000 -840,000 1,682,420 Total Assets 1,802.695 2,002.520 Liabilities Accounts payable 55,000 55,000 56,700 56,700 Stockholder's equity Common stock 500,000 500.000 Retained earnings 1,247,695 1,747.695 1,445,820 1,945,820 Total Liabilities and Stockholder's Equity 1,802,695 2,002,520Exhibit 1. Excel Data Input Section A B A B Input Data (US$) 30 Selling & Administrative (S&A) Costs 2 31 Variable S&A cost per unit sold US$1.25 3 Budgeted Sales Expected 32 Fixed S&A cost per month US$63,000 4 April (units) 2,500 33 Depreciation in fixed S&A cost US$10,000 5 May (units) 6,000 34 6 June (units) 3,000 35 Other Cash Outflows 7 July (units) 2,500 36 Cash dividends paid each month US$15,000 8 August (units) 2,000 37 Equipment purchases May US$47,820 38 Equipment purchases June US$154,600 10 Selling price/unit US$120.00 39 11 40 Desired Ending Inventory 12 Cash Collection Pattern 41 Finished goods 20% 13 Month of sale 40% 42 Raw materials 40% 14 Following month 55% 43 Cash US$30,000 15 Uncollectible 5% 44 16 45 Beginning Account Balances on March 31 17 Cash Payments for Materials 46 Cash US$37,745 18 Month of purchase 40% 47 Accounts receivable US$132,000 19 Following month 60% 48 Finished goods inventory (at US$75/unit) US$30,750 20 49 Finished goods cost per unit US$75.00 21 Production Requirements 50 Finished goods inventory (units) 410 22 Raw material per unit (Ib. 5 51 Raw materials (at US$7.00/lb.) US$32,200 23 Raw material cost per lb. US$7.00 52 Raw materials (lb.) 4.600 24 Direct labor hours per unit 0.5 53 Accounts payable US$55,000 25 Direct labor rate per hour US$40.00 54 26 Variable manufacturing overhead rate per US$10 55 Land US$520,000 direct labor hour 56 Buildings and equipment US$1,800,000 27 Fixed manufacturing overhead cost per month US$57,950 57 Accumulated depreciation (US$750,000) 28 Depreciation in Fixed manufacturing overhead US$20,000 58 Common stock US$500,000 29 59 Retained earnings US$1,247,695 Exhibit 2. Sales at Different Levels Decreased by Budgeted Sales Expected 2% 5% 10% April (units) 2,500 2,450 2,375 2,250 May (units) 6,000 5,880 5,700 5,400 June (units) 3,000 2.940 2.850 2,700 July (units) 2,500 2,450 2,375 2,250 August (units) 2,000 1,960 1,900 1,800 IMA EDUCATIONAL CASE JOURNAL 3 VOL. 11, NO. 4, ART. 4, DECEMBER 2018MANUFACTURING AND SG&A COSTS LOAN DETAILS The flags are made in one plant, which has a capacity of LAF has requested a line of credit of US$60,000 to cover 6,200 units per month. LAF budgets have 20% of next production costs during the seasonal increase in business. month's sales in finished goods inventory at the end of each Kent Bank uses the following terms on its lines of credit. All month. There is plenty of storage space for finished goods. borrowing is done at the beginning of the month in whole Fabric is the only direct material and each flag requires dollar increments. All repayments are made at the end of the five pounds of fabric at US$7 per pound. LAF plans to month in whole dollar increments. The full line of credit is have 40% of next month's fabric needs on hand at the end expected to be paid off by the end of the quarter with all the of the month. Fabric is purchased on credit with 40% paid interest repaid at the end of the quarter. The interest rate on in the month of purchase and 60% paid the next month. this loan is 16% per year. The standard direct labor hours to manufacture one flag is 0.50 hours at US$40 per hour. For simplicity, direct labor REQUIRED costs are budgeted as if they were paid when incurred. Manufacturing overhead rates are computed quarterly and 1. Using the data input provided (Exhibit 1), prepare LAF's applied based on direct labor hours. Fixed manufacturing master budgets in Excel. Do not hard-code numbers into overhead costs are estimated to be US$57,950 per month, of the spreadsheet, except in the financing section of the which US$20,000 is property, plant, and equipment (PPE) cash budget. depreciation. Variable manufacturing overhead, including 2. Conduct a sensitivity analysis, decreasing sales 2%, 5%, indirect materials, indirect labor, and other costs, is estimated and 10% for April through August. New sales levels are at US$10 per direct labor hour. provided in Exhibit 2. Adjust the financing and cash The selling and administrative expenses include variable needs at these new sales levels. selling costs (primarily shipping) of US$1.25 per unit and fixed costs of US$63,000 per month, of which US$10,000 . Determine a credit recommendation for Kent Bank, to is depreciation of the administrative office building and lend or not. Be prepared to justify your credit decision. equipment. 4. Explain why the cash budget is more important to a bank than the accounting net income when determining a FINANCIAL STATEMENT DETAILS AND CASH credit decision. PLANNING . Explain why decreases in sales is examined in a sensitivity analysis for a credit decision. LAF uses first in, first out (FIFO) inventory valuation. As of March 31, the expected finished goods inventory is 410 units, valued at US$75 per unit. The company expects to have 4,600 pounds of fabric on hand, valued at US$7 per pound. ABOUT IMA (INSTITUTE OF MANAGEMENT ACCOUNTANTS) Other expected account balances include accounts payable at IMA, the association of accountants and financial US$55,000, accounts receivable at 132,000, cash at US$37,745, professionals in business, is one of the largest and most land at US$520,000, and building and equipment at respected associations focused exclusively on advancing the US$1,800,000 with accumulated depreciation of US$750,000. management accounting profession. Globally, IMA supports LAF has no long-term debt; common stock is valued at the profession through research, the CMA (Certified US$500,000 and is not expected to change during the quarter; Management Accountant) program, continuing education, networking and advocacy of the highest ethical business expected retained earnings as of March 31 are US$1,247,695. practices. IMA has a global network of more than 100,000 LAF budgets for US$30,000 ending cash balance each members in 140 countries and 300 professional and student month and is requesting a line of credit that will allow it to chapters. Headquartered in Montvale, N.J., USA, IMA adjust for its cash needs. The dividends of US$15,000 are paid provides localized services through its four global regions: The each month. During the quarter, LAF planned to purchase Americas, Asia/Pacific, Europe, and Middle East/India. For equipment in May and June for US$47,820 and US$154,600, more information about IMA, please visit www.imanet.org. respectively. This equipment is being purchased to increase capacity and is not expected to come on line until after the quarter, thus not affecting the manufacturing overhead costs. IMA EDUCATIONAL CASE JOURNAL 2 VOL. 11, NO. 4, ART. 4, DECEMBER 2018
Step by Step Solution
There are 3 Steps involved in it

Get step-by-step solutions from verified subject matter experts