

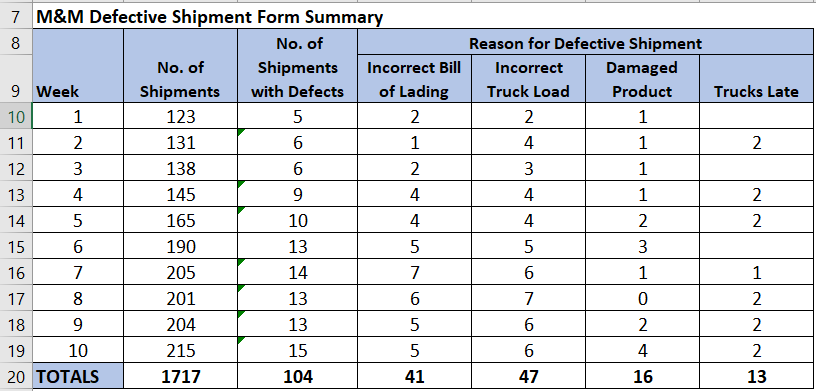
Question: I need help creating a run chart with the below data Trucks Late 2 3 7 M&M Defective Shipment Form Summary 8 No. of No.
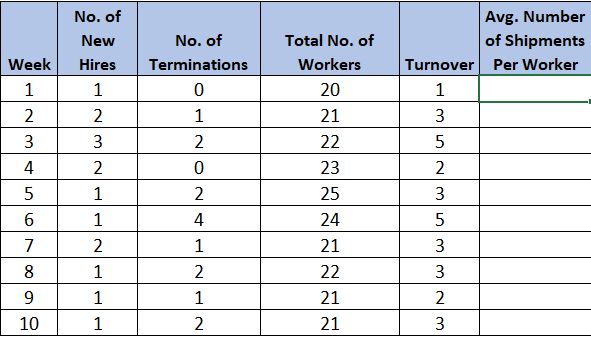
I need help creating a run chart with the below data
Step by Step Solution
There are 3 Steps involved in it
1 Expert Approved Answer
Step: 1 Unlock

Question Has Been Solved by an Expert!
Get step-by-step solutions from verified subject matter experts
Step: 2 Unlock
Step: 3 Unlock