

Question: I need help determining where the operating costs and sales revenues go on the graph and also the last question. Thanks When does a firm
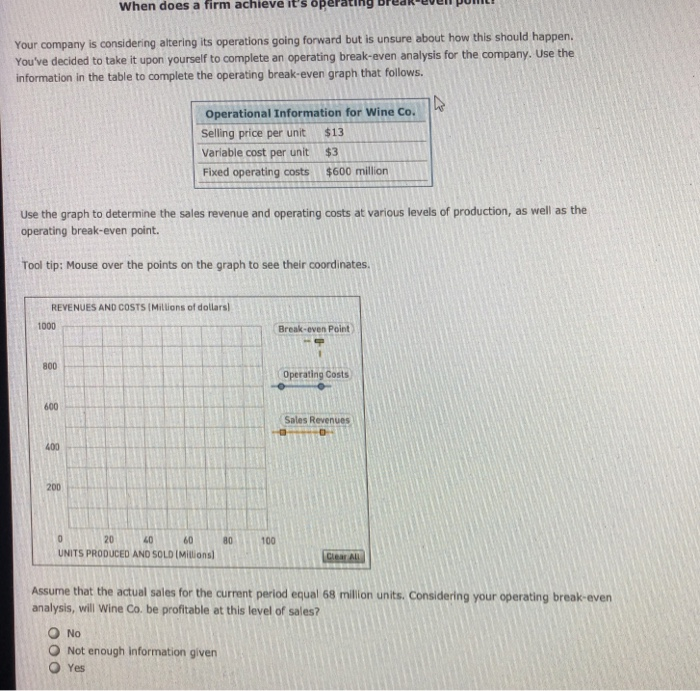
When does a firm achieve it's operating Brek eel po Your company is considering altering its operations going forward but is unsure about how th You've decided to take it upon yourself to complete an operating break-even analysis for the company. use the information in the table to complete the operating break-even graph that follows appen Operational Information for Wine Co. Selling price per unit $13 Variable cost per unit $3 Fixed operating costs $600 million Use the graph to determine the sales revenue and operating costs at various levels of production, as well as the operating break-even point. Tool tip: Mouse over the points on the graph to see their coordinates. REVENUES AND COSTS (Millions of dollars 1000 Break-even Point 800 Operating Costs 600 Sales Revenues 400 200 2040 UNITS PRODUCED AND SOLD (Mitions 6080100 Assume that the actual sales for the current period equal 68 million units. Considering your operating break-even analysis, will Wine Co. be profitable at this level of sales? O No O Not enough information given O Yes
Step by Step Solution
There are 3 Steps involved in it

Get step-by-step solutions from verified subject matter experts