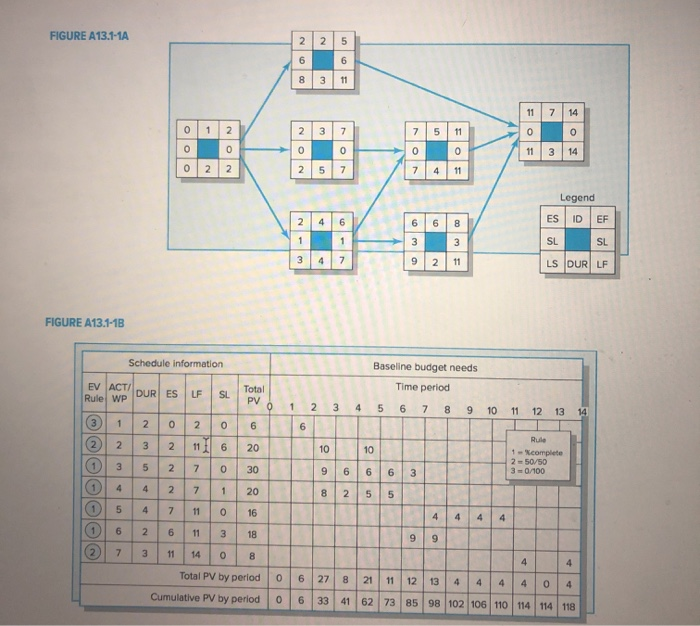
Question: need help with this below after doing the chart above I need assitance with this below. FIGURE A13.1-1A 837 OS WO N Legend ES ID

need help with this below after doing the chart
need help with this below
need help with this below after doing the chart
after doing the chart above I need assitance with this below.
need help with this below after doing the chart
FIGURE A13.1-1A 837 OS WO N Legend ES ID EF 2 46 LS DUR LF FIGURE A13.1-1B / Schedule information Baseline budget needs Time period EV ACTI Rule WP DUR ESLF SL 3 4 5 6 7 8 9 10 11 12 13 14 20206 2 1 1 6 20 10 1 complete 2 50/50 301100 6663 0 6 7 4 2 7 1825 5 47 110 2 6 1 3 18 3 11 14 0 8 Total PV by period 0 6 27 8 21 11 12 13 4 4 4 Cumulative PV by period 0 6 33 41 62 73 85 98 102 106 110 114 114 118 Chapter 13 Progress and Performance Measurement and Evaluation 507 Status Report: Ending Period 1 Task %Complete Cumulative Totals 12 12 Status Report: Ending Period 2 Complete Finished Cumulative Totals Task | Status Report: Ending Period 3 Task Complete Finished 06 81|||| 30% 25% Cumulative Totals Status Report: Ending Period 4 Complete Finished 0% 50% 50% Cumulative Totals Status Report: Ending Period 5 Task XComplete Finished 50% 1112 1111121112 111112 111112 60% 70% Cumulative Totals Status Report: Ending Period 6 Task % Complete Finished 50% 80% Finished Cumulative Totals Status Report: Ending Period 7 Task %Complete Finished Finished Finished Finished IlIlIIl 11!!!!! 50% Cumulative Totals Period SPI C PI PCIB NJ SPI = EV/PV CPI = EVAC PCIB = EV/BAC U FIGURE A13.1-20 FIGURE A13.1-2D Dollars Index SPI= 1 2 3 4 5 6 7 8 9 10 11 12 13 14 Time periods 0 1 2 3 4 Time periods 5 6 7 2. Given the information provided for development of a catalog product return process for periods 1 through 5, assign the PV values (using the rules) to develop a baseline for the project. Compute the SV, CV, SPI, and CPI for each period. Explain to the owner your assessment of the project at the end of period 5 and the future expected status of the project at the completion. FIGURE A13.1-1A 837 OS WO N Legend ES ID EF 2 46 LS DUR LF FIGURE A13.1-1B / Schedule information Baseline budget needs Time period EV ACTI Rule WP DUR ESLF SL 3 4 5 6 7 8 9 10 11 12 13 14 20206 2 1 1 6 20 10 1 complete 2 50/50 301100 6663 0 6 7 4 2 7 1825 5 47 110 2 6 1 3 18 3 11 14 0 8 Total PV by period 0 6 27 8 21 11 12 13 4 4 4 Cumulative PV by period 0 6 33 41 62 73 85 98 102 106 110 114 114 118 Chapter 13 Progress and Performance Measurement and Evaluation 507 Status Report: Ending Period 1 Task %Complete Cumulative Totals 12 12 Status Report: Ending Period 2 Complete Finished Cumulative Totals Task | Status Report: Ending Period 3 Task Complete Finished 06 81|||| 30% 25% Cumulative Totals Status Report: Ending Period 4 Complete Finished 0% 50% 50% Cumulative Totals Status Report: Ending Period 5 Task XComplete Finished 50% 1112 1111121112 111112 111112 60% 70% Cumulative Totals Status Report: Ending Period 6 Task % Complete Finished 50% 80% Finished Cumulative Totals Status Report: Ending Period 7 Task %Complete Finished Finished Finished Finished IlIlIIl 11!!!!! 50% Cumulative Totals Period SPI C PI PCIB NJ SPI = EV/PV CPI = EVAC PCIB = EV/BAC U FIGURE A13.1-20 FIGURE A13.1-2D Dollars Index SPI= 1 2 3 4 5 6 7 8 9 10 11 12 13 14 Time periods 0 1 2 3 4 Time periods 5 6 7 2. Given the information provided for development of a catalog product return process for periods 1 through 5, assign the PV values (using the rules) to develop a baseline for the project. Compute the SV, CV, SPI, and CPI for each period. Explain to the owner your assessment of the project at the end of period 5 and the future expected status of the project at the completion

Step by Step Solution

There are 3 Steps involved in it

1 Expert Approved Answer
Step: 1 Unlock blur-text-image
Question Has Been Solved by an Expert!

Get step-by-step solutions from verified subject matter experts

Step: 2 Unlock
Step: 3 Unlock

Students Have Also Explored These Related General Management Questions!