

Question: i need help figuring out these steps on excel windowns this is what it should end up looking like ... this is my starting page
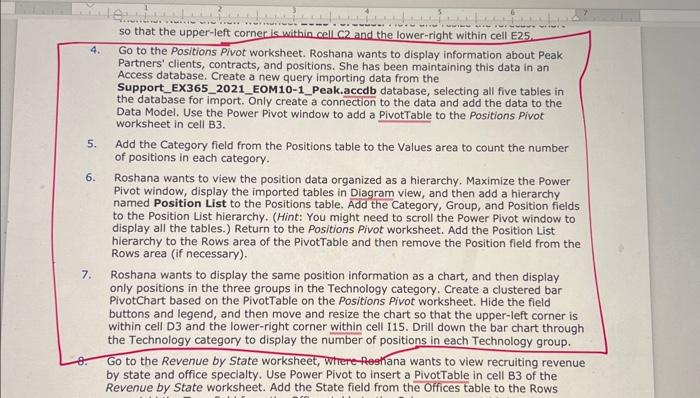
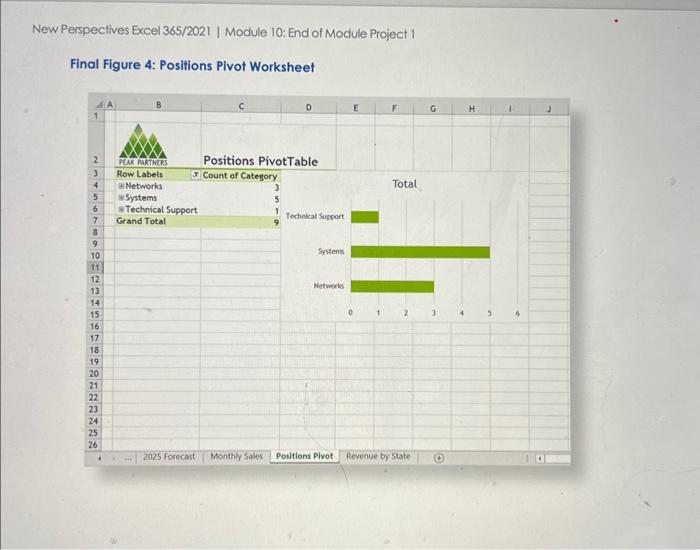
New Perspectives Excel 365/2021 | Module 10: End of Module Project 1 Final Figure 4: Positions Pivot Worksheet Positions PivotTable 4. Go to the Positions Pivot worksheet. Roshana wants to display information about Peak Partners' clients, contracts, and positions. She has been maintaining this data in an Access database. Create a new query importing data from the Support_EX365_2021_EOM10-1_Peak.accdb database, selecting all five tables in the database for import. Only create a connection to the data and add the data to the Data Model. Use the Power Pivot window to add a PivotTable to the Positions Pivot worksheet in cell B3. 5. Add the Category field from the Positions table to the Values area to count the number of positions in each category. 6. Roshana wants to view the position data organized as a hierarchy. Maximize the Power Pivot window, display the imported tables in Diagram view, and then add a hierarchy named Position List to the Positions table. Add the Category, Group, and Position fields to the Position List hierarchy. (Hint: You might need to scroll the Power Pivot window to display all the tables.) Return to the Positions Pivot worksheet. Add the Position List hierarchy to the Rows area of the PivotTable and then remove the Position field from the Rows area (if necessary). 7. Roshana wants to display the same position information as a chart, and then display only positions in the three groups in the Technology category. Create a clustered bar PivotChart based on the PivotTable on the Positions Pivot worksheet. Hide the field buttons and legend, and then move and resize the chart so that the upper-left corner is within cell D3 and the lower-right corner within cell I15. Drill down the bar chart through the Technology category to display the number of positions in each Technology group. Go to the Revenue by State worksheet, Where-feghana wants to view recruiting revenue by state and office specialty. Use Power Pivot to insert a PivotTable in cell B3 of the
Step by Step Solution
There are 3 Steps involved in it

Get step-by-step solutions from verified subject matter experts