

Question: I need help figuring out this problem in Matlab, the file US_Grain.dat is a long list of data, a picture of it is uploaded here.
I need help figuring out this problem in Matlab, the file US_Grain.dat is a long list of data, a picture of it is uploaded here.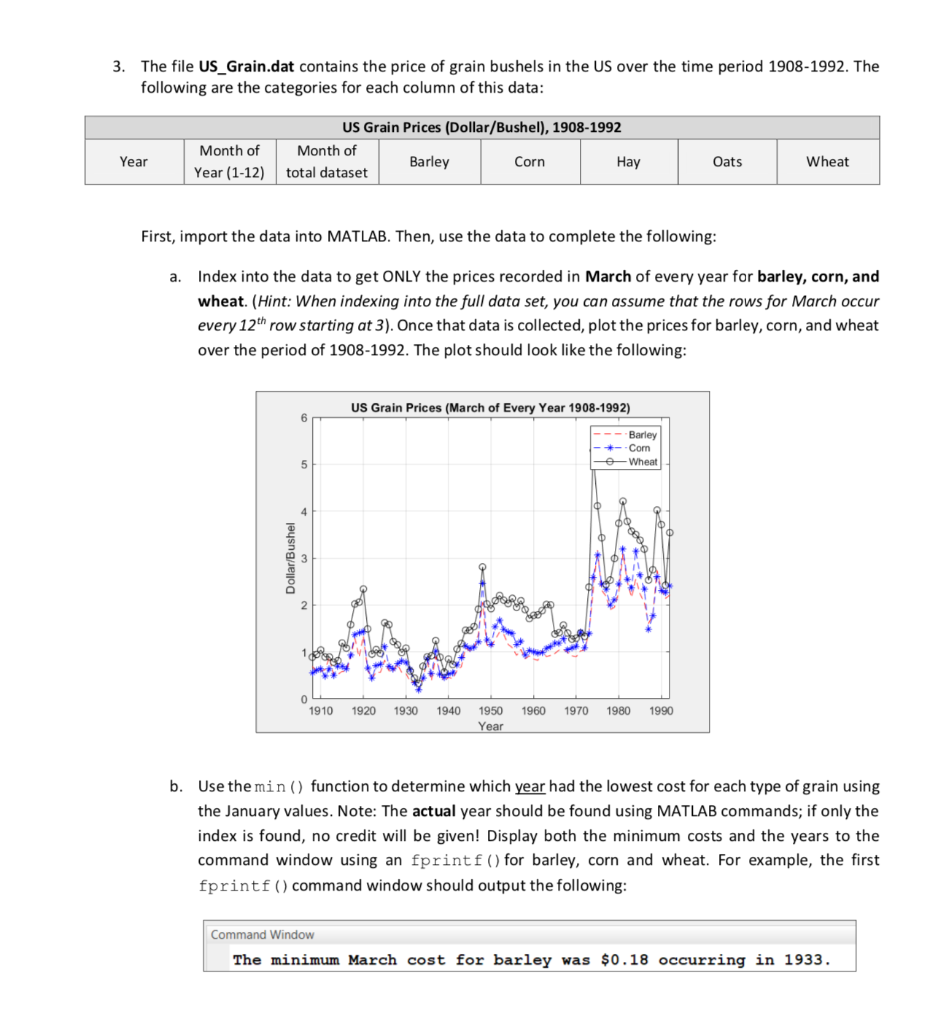
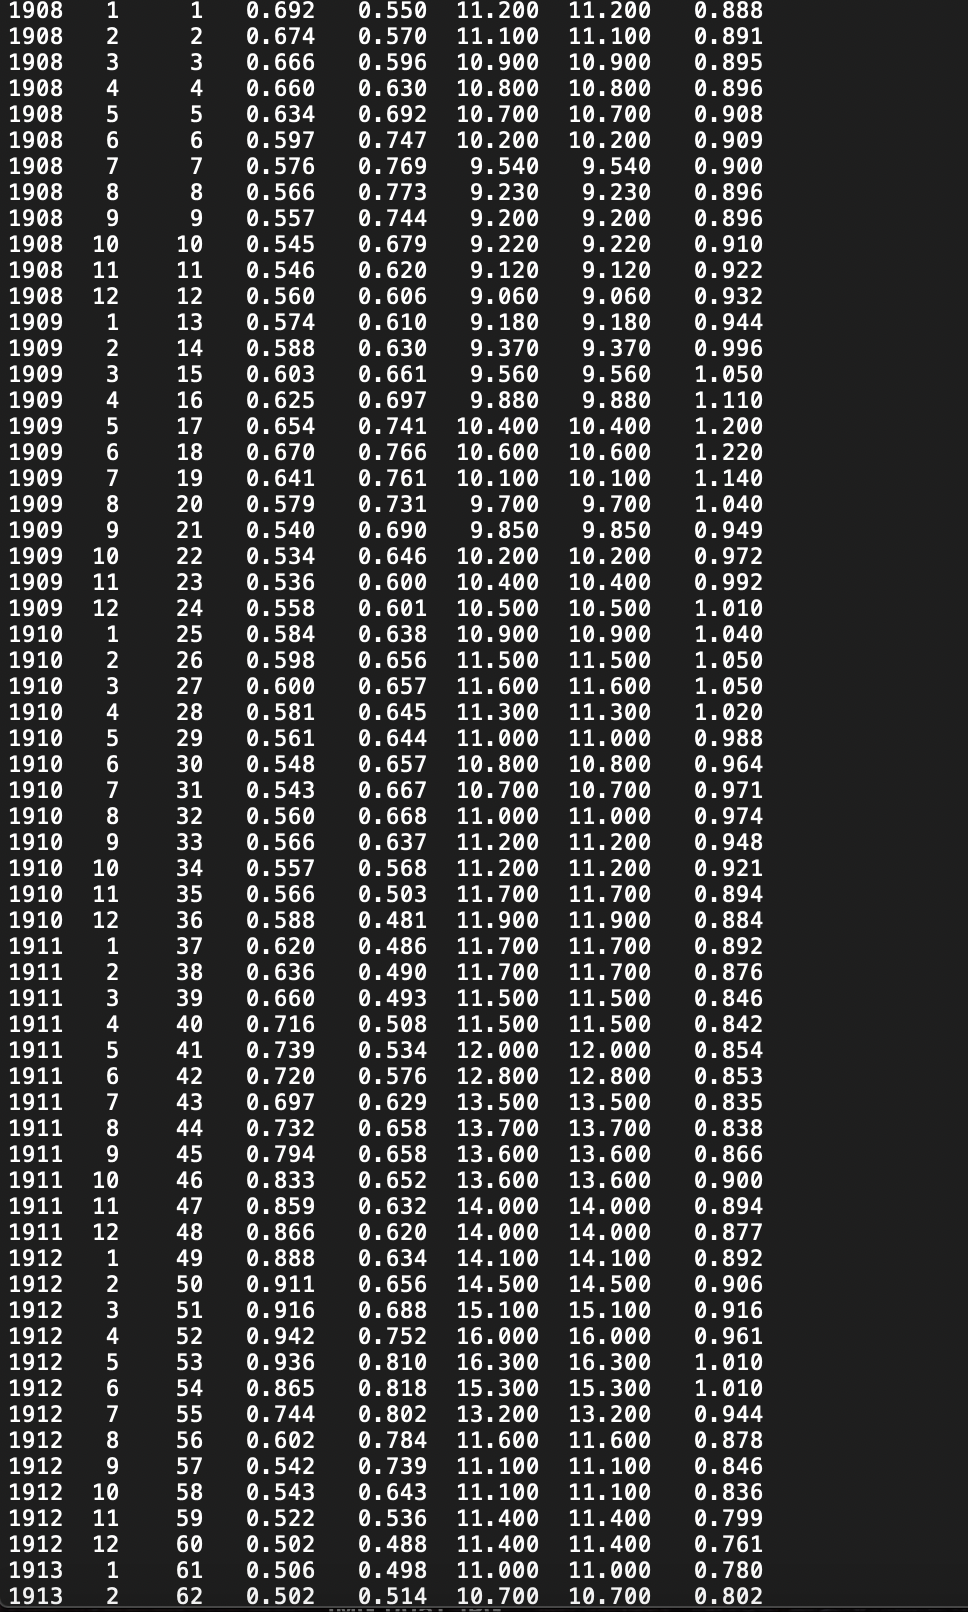
3. The file US_Grain.dat contains the price of grain bushels in the US over the time period 1908-1992. The following are the categories for each column of this data: US Grain Prices (Dollar/Bushel), 1908-1992 Month of Barley Corn Hay total dataset Month of Year (1-12) Year Oats Wheat First, import the data into MATLAB. Then, use the data to complete the following: a. Index into the data to get ONLY the prices recorded in March of every year for barley, corn, and wheat. (Hint: When indexing into the full data set, you can assume that the rows for March occur every 12th row starting at 3). Once that data is collected, plot the prices for barley, corn, and wheat over the period of 1908-1992. The plot should look like the following: US Grain Prices (March of Every Year 1908-1992) ---Barley -*--Com Go Wheat Dollar/Bushel a boos 206 g 1910 1920 1930 1940 1950 Year 1960 1970 1980 1990 b. Use the min() function to determine which year had the lowest cost for each type of grain using the January values. Note: The actual year should be found using MATLAB commands; if only the index is found, no credit will be given! Display both the minimum costs and the years to the command window using an fprintf() for barley, corn and wheat. For example, the first fprintf() command window should output the following: Command Window The minimum March cost for barley was $0.18 occurring in 1933. 23456789 12345678 10 234567 16 17 18 21 22 1908 1908 1908 1908 1908 1908 1908 1908 1908 1908 1908 1909 1909 1909 1909 1909 1909 1909 1909 1909 1909 10 1909 11 1909 1910 1910 1910 1910 1910 1910 1910 11910 | 1910 9 [1910 1910 11 1910 12 1911 1911 1911 1911 1911 1911 1911 123456 29 30 31 | U-U1Z 1.550 11.200 11.200 0.888 0.674 | 0.570 11.100 11.100 0.891 0.666 10.596 10.900 10.900 10.895 0.660 0.630 10.800 10.800 0.896 0.634 10.692 10.700 10.700 0.908 0.597 0.747 10.200 10.200 0.909 0.576 0.769 19.540 | 9.540 0.900 0.566 0.773 9.230 9.230 0.896 0.557 0.744 9.200 9.200 0.896 0.545 0.679 9.220 19.220 0.910 0.546 0.620 9.120 9.120 0.922 0.560 0.606 19.060 9.060 0.932 13 0.574 0.610 9.180 9.180 0.944 0.588 0.630 9.370 9.370 0.996 0.603 0.661 19.560 9.560 1.050 0.625 0.697 9.880 9,880 1.110 0.654 0.741 10.400 10.400 1.200 0.670 0.766 10.600 10.600 19 0.641 11.220 0.761 10.100 10.100; 1.140 20 0.579 0.7319.700 9.700 1.040 0.540 0.690 9.850 9.850 10.949 0.534 0.646 10.200 10.200 0.972 0.536 0.600 10.400 10.400; 0.992 0.558 0.601 10.500 10.500 | 1.010 0.584 10.638 10.900 10.900; 1.040 26 0.598 0.656 11.500 11.500 | 1.050 27 0.600 10.657 11.600 11.600 | 1.050 28 0.581 0.645 11.300 11.300 1.020 0.561 10.644 11.000 11.000 0.988 0.548 10.657 10.800 10.800 0.964 0.543 0.667 10.700 10.700 0.971 32 0.560 0.668 11.000 11.000 0.974 33 0.566 0.637 11.200 11.200 0.9488 0.557 0.568 11.200 11.200 0.921 0.566 10.503 11.700 11.700 0.894 0.588 0.481 11.900 11.900 0.884 0.620 0.486 11.700 11.700 0.892 38 0.636 0.490 11.700 11.700 0.876 39 0.660 | 0.493 11.500 11.500 0.846 40 0.716 0.508 11.500 11.500 0.842 41 0.739 0.534 12.000 12.000 0.720 0.854 0.576 12.800 12.800, 0.853 0.697 0.629 13.500 13.500 10.835 0.732 | 0.658 13.700 13.700; | 0.838 45 0.794 10.658 13.600 13.600 0.866 0.652 13.600 13.600, 0.900 0.859 0.632 14.000 14.000 0.894 488 0.866 10.620 14.000 14.000 0.877 49 0.888 0.634 14.100 14.100 0.892 50 0.911 | 0.656 14.500 14.500 0.906 0.916 0.688 15.100 15.100; 0.916 52 0.942 0.752 16.000 16.000 0.961 0.936 0.810 16.300 16.300; 1.010 0.865 0.818 15.300 15.300; 1.010 55 10.744 10.802 13.200 13.200 0.944 56 0.602 10.784 11.600 11.600 0.878 57 0.542 0.739 11.100 11.100 58 0.846 10.543 0.643 11.100 11.100 0.836 0.522 | 0.536 11.400 11.400 60 0.799 0.502 | 0.488 11.400 11.400 10.761 0.506 | 0.498 11.000 11.000, 62 0.780 0.502 0.514 10.700 10.700 0.802 34 35 36 37 1911 43 44 1911 911 911 911 0.833 912 123456789 99uu123456789wug 912 912 912 012 53 54 12 12 12 12 59 | 11 12 12 13 1 13 2 61 3. The file US_Grain.dat contains the price of grain bushels in the US over the time period 1908-1992. The following are the categories for each column of this data: US Grain Prices (Dollar/Bushel), 1908-1992 Month of Barley Corn Hay total dataset Month of Year (1-12) Year Oats Wheat First, import the data into MATLAB. Then, use the data to complete the following: a. Index into the data to get ONLY the prices recorded in March of every year for barley, corn, and wheat. (Hint: When indexing into the full data set, you can assume that the rows for March occur every 12th row starting at 3). Once that data is collected, plot the prices for barley, corn, and wheat over the period of 1908-1992. The plot should look like the following: US Grain Prices (March of Every Year 1908-1992) ---Barley -*--Com Go Wheat Dollar/Bushel a boos 206 g 1910 1920 1930 1940 1950 Year 1960 1970 1980 1990 b. Use the min() function to determine which year had the lowest cost for each type of grain using the January values. Note: The actual year should be found using MATLAB commands; if only the index is found, no credit will be given! Display both the minimum costs and the years to the command window using an fprintf() for barley, corn and wheat. For example, the first fprintf() command window should output the following: Command Window The minimum March cost for barley was $0.18 occurring in 1933. 23456789 12345678 10 234567 16 17 18 21 22 1908 1908 1908 1908 1908 1908 1908 1908 1908 1908 1908 1909 1909 1909 1909 1909 1909 1909 1909 1909 1909 10 1909 11 1909 1910 1910 1910 1910 1910 1910 1910 11910 | 1910 9 [1910 1910 11 1910 12 1911 1911 1911 1911 1911 1911 1911 123456 29 30 31 | U-U1Z 1.550 11.200 11.200 0.888 0.674 | 0.570 11.100 11.100 0.891 0.666 10.596 10.900 10.900 10.895 0.660 0.630 10.800 10.800 0.896 0.634 10.692 10.700 10.700 0.908 0.597 0.747 10.200 10.200 0.909 0.576 0.769 19.540 | 9.540 0.900 0.566 0.773 9.230 9.230 0.896 0.557 0.744 9.200 9.200 0.896 0.545 0.679 9.220 19.220 0.910 0.546 0.620 9.120 9.120 0.922 0.560 0.606 19.060 9.060 0.932 13 0.574 0.610 9.180 9.180 0.944 0.588 0.630 9.370 9.370 0.996 0.603 0.661 19.560 9.560 1.050 0.625 0.697 9.880 9,880 1.110 0.654 0.741 10.400 10.400 1.200 0.670 0.766 10.600 10.600 19 0.641 11.220 0.761 10.100 10.100; 1.140 20 0.579 0.7319.700 9.700 1.040 0.540 0.690 9.850 9.850 10.949 0.534 0.646 10.200 10.200 0.972 0.536 0.600 10.400 10.400; 0.992 0.558 0.601 10.500 10.500 | 1.010 0.584 10.638 10.900 10.900; 1.040 26 0.598 0.656 11.500 11.500 | 1.050 27 0.600 10.657 11.600 11.600 | 1.050 28 0.581 0.645 11.300 11.300 1.020 0.561 10.644 11.000 11.000 0.988 0.548 10.657 10.800 10.800 0.964 0.543 0.667 10.700 10.700 0.971 32 0.560 0.668 11.000 11.000 0.974 33 0.566 0.637 11.200 11.200 0.9488 0.557 0.568 11.200 11.200 0.921 0.566 10.503 11.700 11.700 0.894 0.588 0.481 11.900 11.900 0.884 0.620 0.486 11.700 11.700 0.892 38 0.636 0.490 11.700 11.700 0.876 39 0.660 | 0.493 11.500 11.500 0.846 40 0.716 0.508 11.500 11.500 0.842 41 0.739 0.534 12.000 12.000 0.720 0.854 0.576 12.800 12.800, 0.853 0.697 0.629 13.500 13.500 10.835 0.732 | 0.658 13.700 13.700; | 0.838 45 0.794 10.658 13.600 13.600 0.866 0.652 13.600 13.600, 0.900 0.859 0.632 14.000 14.000 0.894 488 0.866 10.620 14.000 14.000 0.877 49 0.888 0.634 14.100 14.100 0.892 50 0.911 | 0.656 14.500 14.500 0.906 0.916 0.688 15.100 15.100; 0.916 52 0.942 0.752 16.000 16.000 0.961 0.936 0.810 16.300 16.300; 1.010 0.865 0.818 15.300 15.300; 1.010 55 10.744 10.802 13.200 13.200 0.944 56 0.602 10.784 11.600 11.600 0.878 57 0.542 0.739 11.100 11.100 58 0.846 10.543 0.643 11.100 11.100 0.836 0.522 | 0.536 11.400 11.400 60 0.799 0.502 | 0.488 11.400 11.400 10.761 0.506 | 0.498 11.000 11.000, 62 0.780 0.502 0.514 10.700 10.700 0.802 34 35 36 37 1911 43 44 1911 911 911 911 0.833 912 123456789 99uu123456789wug 912 912 912 012 53 54 12 12 12 12 59 | 11 12 12 13 1 13 2 61
Step by Step Solution
There are 3 Steps involved in it

Get step-by-step solutions from verified subject matter experts