

Question: I need help finding Operating cash flow using excel to solve for each of the years. This is question #3 DOVER CORP (DOV) INCOME STATEMENT
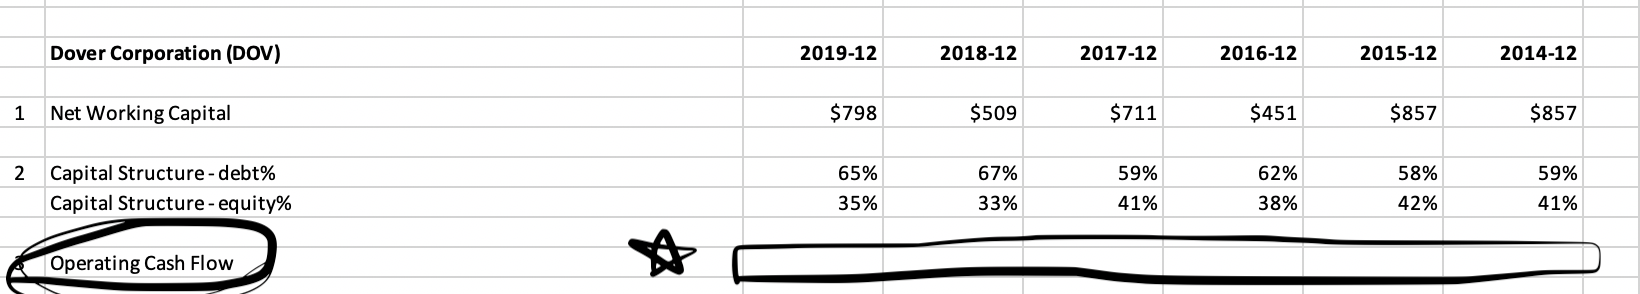 I need help finding Operating cash flow using excel to solve for each of the years. This is question #3
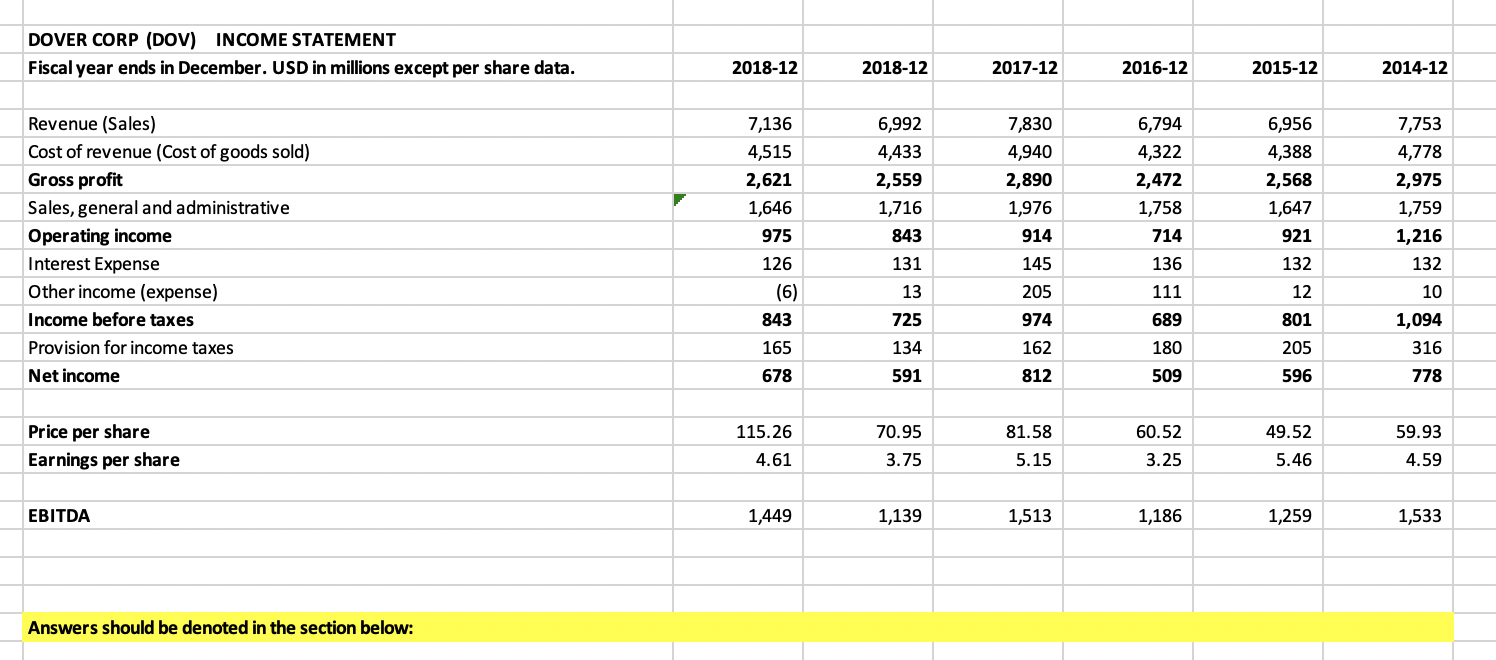
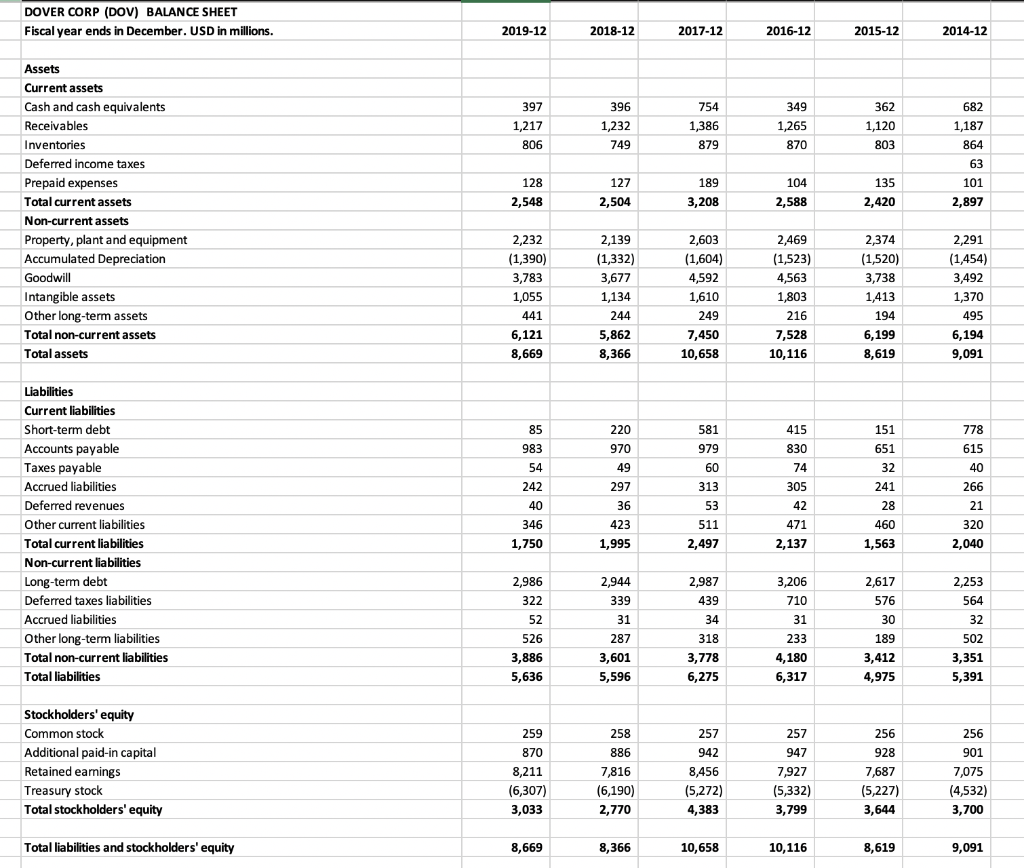
DOVER CORP (DOV) INCOME STATEMENT Fiscal year ends in December. USD in millions except per share data. 2018-12 2018-12 2017-12 2016-12 2015-12 2014-12 6,992 4,433 2,559 1,716 7,136 4,515 2,621 1,646 975 126 (6) 843 7,830 4,940 2,890 1,976 914 6,794 4,322 2,472 1,758 714 6,956 4,388 2,568 1,647 921 Revenue (Sales) Cost of revenue (Cost of goods sold) Gross profit Sales, general and administrative Operating income Interest Expense Other income (expense) Income before taxes Provision for income taxes Net income 843 7,753 4,778 2,975 1,759 1,216 132 10 1,094 316 145 136 132 131 13 205 111 12 801 725 974 689 165 134 180 205 162 812 678 591 509 596 778 115.26 49.52 Price per share Earnings per share 70.95 3.75 81.58 5.15 60.52 3.25 59.93 4.59 4.61 5.46 EBITDA 1,449 1,139 1,513 1,186 1,259 1,533 Answers should be denoted in the section below: DOVER CORP (DOV) BALANCE SHEET Fiscal year ends in December. USD in millions. 2019-12 2018-12 2017-12 2016-12 2015-12 2014-12 396 362 682 397 1,217 806 1,232 749 754 1,386 879 349 1,265 870 1,120 803 1,187 864 63 101 128 2,548 127 2,504 189 3,208 104 2,588 135 2,420 2,897 Assets Current assets Cash and cash equivalents Receivables Inventories Deferred income taxes Prepaid expenses Total current assets Non-current assets Property, plant and equipment Accumulated Depreciation Goodwill Intangible assets Other long-term assets Total non-current assets Total assets 2,232 (1,390) 3,783 1,055 441 6,121 2,139 (1,332) 3,677 1,134 244 5,862 8,366 2,603 (1,604) 4,592 1,610 249 7,450 10,658 2,469 (1,523) 4,563 1,803 216 7,528 10,116 2,374 (1,520) 3,738 1,413 194 6,199 8,619 2,291 (1,454) 3,492 1,370 495 6,194 9,091 8,669 151 415 830 74 651 32 778 615 40 85 983 54 242 40 346 1,750 220 970 49 297 36 423 1,995 581 979 60 313 53 511 2,497 305 Liabilities Current liabilities Short-term debt Accounts payable Taxes payable Accrued liabilities Deferred revenues Other current liabilities Total current liabilities Non-current liabilities Long-term debt Deferred taxes liabilities Accrued liabilities Other long-term liabilities Total non-current liabilities Total liabilities 241 266 42 471 2,137 28 460 1,563 21 320 2,040 2,617 576 2,253 564 2,986 322 52 526 3,886 30 32 2,944 339 31 287 3,601 5,596 2,987 439 34 318 3,778 6,275 3,206 710 31 233 4,180 6,317 189 3,412 4,975 502 3,351 5,391 5,636 257 257 256 928 Stockholders' equity Common stock Additional paid-in capital Retained earnings Treasury stock Total stockholders' equity 259 870 8,211 (6,307) 3,033 258 886 7,816 (6,190) 2,770 942 8,456 (5,272) 4,383 947 7,927 (5,332) 3,799 7,687 (5,227) 3,644 256 901 7,075 (4,532) 3,700 Total liabilities and stockholders' equity 8,669 8,366 10,658 10,116 8,619 9,091 Dover Corporation (DOV) 2019-12 2018-12 2017-12 2016-12 2015-12 2014-12 1 Net Working Capital $798 $509 $711 $451 $857 $857 65% 59% 62% 2 Capital Structure-debt% Capital Structure-equity% 67% 33% 58% 42% 59% 41% 35% 41% 38% Operating Cash Flow DOVER CORP (DOV) INCOME STATEMENT Fiscal year ends in December. USD in millions except per share data. 2018-12 2018-12 2017-12 2016-12 2015-12 2014-12 6,992 4,433 2,559 1,716 7,136 4,515 2,621 1,646 975 126 (6) 843 7,830 4,940 2,890 1,976 914 6,794 4,322 2,472 1,758 714 6,956 4,388 2,568 1,647 921 Revenue (Sales) Cost of revenue (Cost of goods sold) Gross profit Sales, general and administrative Operating income Interest Expense Other income (expense) Income before taxes Provision for income taxes Net income 843 7,753 4,778 2,975 1,759 1,216 132 10 1,094 316 145 136 132 131 13 205 111 12 801 725 974 689 165 134 180 205 162 812 678 591 509 596 778 115.26 49.52 Price per share Earnings per share 70.95 3.75 81.58 5.15 60.52 3.25 59.93 4.59 4.61 5.46 EBITDA 1,449 1,139 1,513 1,186 1,259 1,533 Answers should be denoted in the section below: DOVER CORP (DOV) BALANCE SHEET Fiscal year ends in December. USD in millions. 2019-12 2018-12 2017-12 2016-12 2015-12 2014-12 396 362 682 397 1,217 806 1,232 749 754 1,386 879 349 1,265 870 1,120 803 1,187 864 63 101 128 2,548 127 2,504 189 3,208 104 2,588 135 2,420 2,897 Assets Current assets Cash and cash equivalents Receivables Inventories Deferred income taxes Prepaid expenses Total current assets Non-current assets Property, plant and equipment Accumulated Depreciation Goodwill Intangible assets Other long-term assets Total non-current assets Total assets 2,232 (1,390) 3,783 1,055 441 6,121 2,139 (1,332) 3,677 1,134 244 5,862 8,366 2,603 (1,604) 4,592 1,610 249 7,450 10,658 2,469 (1,523) 4,563 1,803 216 7,528 10,116 2,374 (1,520) 3,738 1,413 194 6,199 8,619 2,291 (1,454) 3,492 1,370 495 6,194 9,091 8,669 151 415 830 74 651 32 778 615 40 85 983 54 242 40 346 1,750 220 970 49 297 36 423 1,995 581 979 60 313 53 511 2,497 305 Liabilities Current liabilities Short-term debt Accounts payable Taxes payable Accrued liabilities Deferred revenues Other current liabilities Total current liabilities Non-current liabilities Long-term debt Deferred taxes liabilities Accrued liabilities Other long-term liabilities Total non-current liabilities Total liabilities 241 266 42 471 2,137 28 460 1,563 21 320 2,040 2,617 576 2,253 564 2,986 322 52 526 3,886 30 32 2,944 339 31 287 3,601 5,596 2,987 439 34 318 3,778 6,275 3,206 710 31 233 4,180 6,317 189 3,412 4,975 502 3,351 5,391 5,636 257 257 256 928 Stockholders' equity Common stock Additional paid-in capital Retained earnings Treasury stock Total stockholders' equity 259 870 8,211 (6,307) 3,033 258 886 7,816 (6,190) 2,770 942 8,456 (5,272) 4,383 947 7,927 (5,332) 3,799 7,687 (5,227) 3,644 256 901 7,075 (4,532) 3,700 Total liabilities and stockholders' equity 8,669 8,366 10,658 10,116 8,619 9,091 Dover Corporation (DOV) 2019-12 2018-12 2017-12 2016-12 2015-12 2014-12 1 Net Working Capital $798 $509 $711 $451 $857 $857 65% 59% 62% 2 Capital Structure-debt% Capital Structure-equity% 67% 33% 58% 42% 59% 41% 35% 41% 38% Operating Cash Flow
Step by Step Solution
There are 3 Steps involved in it

Get step-by-step solutions from verified subject matter experts