Question: I need help finding the upper/lower control limits, please. Boxes of Honey-Nut Oatmeal are produced to contain 14.0 ounces, with a standard deviation of 0.15

I need help finding the upper/lower control limits, please.I need help finding the upper/lower control

Boxes of Honey-Nut Oatmeal are produced to contain 14.0 ounces, with a standard deviation of 0.15 ounce. For a sample size of 49, the 3-sigma x chart control limits are: Upper Control Limit (UCL;) = ounces (round your response to two decimal places). Lower Control Limit (LCL;) - ounces (round your response to two decimal places)

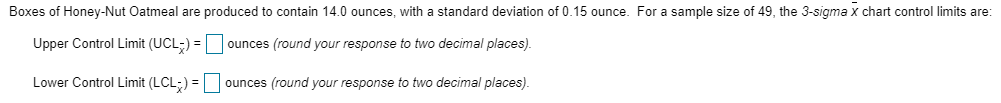
Step by Step Solution

There are 3 Steps involved in it

1 Expert Approved Answer
Step: 1 Unlock blur-text-image
Question Has Been Solved by an Expert!

Get step-by-step solutions from verified subject matter experts

Step: 2 Unlock
Step: 3 Unlock

Students Have Also Explored These Related General Management Questions!