

Question: I need help finishing this code. All codes should be good I just need help with 3.6 in the guidelines above. testproject.py should implement the
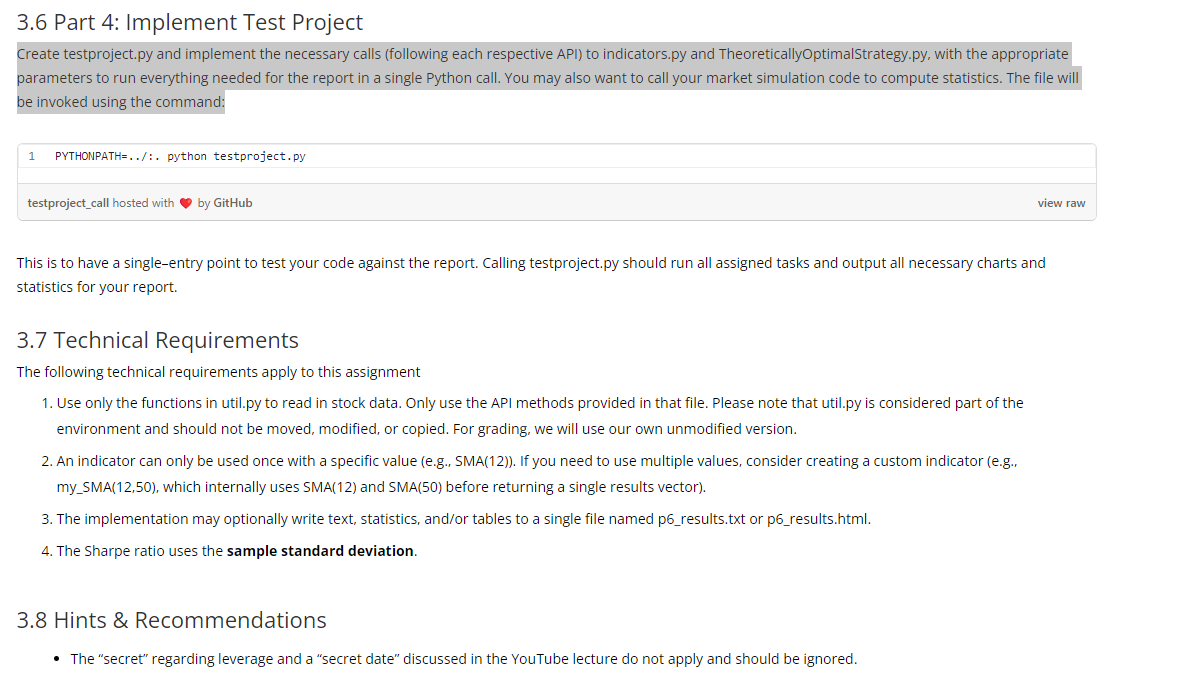
I need help finishing this code. All codes should be good I just need help with 3.6 in the guidelines above. testproject.py should implement the correct calls to indicators and TheoreticallOptimalStrategy with the appropriate parameters to run everything and to gain the graphs. These graphs should be printed in the testproject, not another file. Please help in getting this fixed and running properly. Thanks in advance!
TheoreticallyOptimalStrategy.py
import pandas as pd
import datetime as dt
class TheoreticallyOptimalStrategy:
def testPolicy(self, symbol, sd, ed, sv):
# date range for the specified start and end dates
dates = pd.date_range(sd, ed)
# DataFrame for trades, initialize all trades to 0
trades = pd.DataFrame(index=dates)
trades[symbol] = 0
# Determine the number of trading days
num_trading_days = len(dates)
# Determine the maximum number of shares that can be bought/sold
max_shares = 1000
# Calculate the number of shares to buy/sell on each trading day
shares_per_day = max_shares // 2
# Buy and sell alternatively each day (starting with buying)
for i in range(num_trading_days):
if i % 2 == 0:
trades.iloc[i] = shares_per_day
else:
trades.iloc[i] = -shares_per_day
return trades
indicators.py
import pandas as pd
import matplotlib.pyplot as plt
def bollinger_bands(df, window=20):
rolling_mean = df['Price'].rolling(window=window).mean()
rolling_std = df['Price'].rolling(window=window).std()
upper_band = rolling_mean + (2 * rolling_std)
lower_band = rolling_mean - (2 * rolling_std)
return upper_band, lower_band
def relative_strength_index(df, window=14):
daily_returns = df['Price'].pct_change()
gain = daily_returns.where(daily_returns > 0, 0)
loss = -daily_returns.where(daily_returns
avg_gain = gain.rolling(window=window).mean()
avg_loss = loss.rolling(window=window).mean()
relative_strength = avg_gain / avg_loss
rsi = 100 - (100 / (1 + relative_strength))
return rsi
def moving_average_convergence_divergence(df, short_window=12, long_window=26, signal_window=9):
short_ema = df['Price'].ewm(span=short_window, adjust=False).mean()
long_ema = df['Price'].ewm(span=long_window, adjust=False).mean()
macd = short_ema - long_ema
signal = macd.ewm(span=signal_window, adjust=False).mean()
return macd, signal
def stochastic_oscillator(df, window=14):
high = df['High'].rolling(window=window).max()
low = df['Low'].rolling(window=window).min()
stochastic_osc = (df['Price'] - low) / (high - low) * 100
return stochastic_osc
def percentage_price_indicator(df, window=20):
rolling_max = df['Price'].rolling(window=window).max()
rolling_min = df['Price'].rolling(window=window).min()
ppi = (df['Price'] - rolling_min) / (rolling_max - rolling_min)
return ppi
# Example usage for each indicator
if __name__ == "__main__":
# Load price data using util.py or from a CSV file
df = pd.read_csv('../data/JPM.csv', index_col='Date', parse_dates=True, usecols=['Date', 'Adj Close', 'High', 'Low'])
# sub-plots for each indicator
fig, axes = plt.subplots(5, 1, figsize=(10, 15))
# Calculate and plot Bollinger Bands
upper_band, lower_band = bollinger_bands(df)
axes[0].plot(df.index, df['Adj Close'], label='Price')
axes[0].plot(upper_band.index, upper_band, label='Upper Bollinger Band', color='orange')
axes[0].plot(lower_band.index, lower_band, label='Lower Bollinger Band', color='green')
axes[0].set_title('Bollinger Bands')
axes[0].legend()
# Calculate and plot RSI
rsi = relative_strength_index(df)
axes[1].plot(rsi.index, rsi, label='RSI', color='purple')
axes[1].set_title('Relative Strength Index (RSI)')
axes[1].legend()
# Calculate and plot MACD
macd, signal = moving_average_convergence_divergence(df)
axes[2].plot(df.index, df['Adj Close'], label='Price')
axes[2].plot(macd.index, macd, label='MACD', color='orange')
axes[2].plot(signal.index, signal, label='Signal Line', color='green')
axes[2].set_title('Moving Average Convergence Divergence (MACD)')
axes[2].legend()
# Calculate and plot Stochastic Oscillator
stochastic_osc = stochastic_oscillator(df)
axes[3].plot(stochastic_osc.index, stochastic_osc, label='Stochastic Oscillator', color='purple')
axes[3].set_title('Stochastic Oscillator')
axes[3].legend()
# Calculate and plot Percentage Price Indicator
ppi = percentage_price_indicator(df)
axes[4].plot(ppi.index, ppi, label='Percentage Price Indicator', color='orange')
axes[4].set_title('Percentage Price Indicator')
axes[4].legend()
plt.tight_layout()
plt.show()
testproject.py
import datetime as dt
import TheoreticallyOptimalStrategy as tos
import marketsimcode as ms
def calculate_portfolio_statistics(start_date, end_date, symbol, start_value):
# instance of the TheoreticallyOptimalStrategy
tos_strategy = tos.TheoreticallyOptimalStrategy()
# Get trades generated by the TOS strategy
trades = tos_strategy.testPolicy(symbol, start_date, end_date, start_value)
# Call the market simulator with the generated trades
portvals = ms.compute_portvals(trades, start_date, end_date, start_value)
# Calculate daily returns
daily_returns = portvals / portvals.shift(1) - 1
daily_returns.iloc[0] = 0 # Set the first day's return to 0
# Calculate statistics
cumulative_return = portvals.iloc[-1] / portvals.iloc[0] - 1
stdev_daily_returns = daily_returns.std()
mean_daily_returns = daily_returns.mean()
return cumulative_return, stdev_daily_returns, mean_daily_returns
if __name__ == "__main__":
symbol = "JPM"
start_date = dt.datetime(2008, 1, 1)
end_date = dt.datetime(2009, 12, 31)
start_value = 100000
# Calculate portfolio statistics
cumulative_return, stdev_daily_returns, mean_daily_returns = calculate_portfolio_statistics(start_date, end_date, symbol, start_value)
# Print the results
print(f"Cumulative return: {cumulative_return:.6f}")
print(f"Stdev of daily returns: {stdev_daily_returns:.6f}")
print(f"Mean of daily returns: {mean_daily_returns:.6f}")
marketsimcode.py
import datetime as dt
import numpy as np
import pandas as pd
from util import get_data, plot_data
def compute_portvals(
trades_df = None,
orders_file="./orders/orders.csv",
start_val=1000000,
commission=9.95,
impact=0.005,
):
"""
Computes the portfolio values.
:param orders_file: Path of the order file or the file object
:type orders_file: str or file object
:param start_val: The starting value of the portfolio
:type start_val: int
:param commission: The fixed amount in dollars charged for each transaction (both entry and exit)
:type commission: float
:param impact: The amount the price moves against the trader compared to the historical data at each transaction
:type impact: float
:return: the result (portvals) as a single-column dataframe, containing the value of the portfolio for each trading day in the first column from start_date to end_date, inclusive.
:rtype: pandas.DataFrame
"""
# Initialize variables and data
if trades_df is not None:
start_date, end_date, order_dates = get_dates(trades_df)
else:
orders_df = pd.read_csv(orders_file, index_col='Date', parse_dates=True, na_values=['nan'])
start_date, end_date, order_dates = get_dates(orders_df)
portfolio_vals = get_data(['SPY'], pd.date_range(start_date, end_date), addSPY=True, colname='Adj Close')
portfolio_vals = portfolio_vals.rename(columns={'SPY': 'Portfolio Value'})
dates = portfolio_vals.index
current_cash = start_val
shares_owned = {}
symbol_data = {}
# Loop through dates and execute orders
for current_date in dates:
if current_date in order_dates:
details = orders_df.loc[current_date]
if isinstance(details, pd.DataFrame):
for _, row in details.iterrows():
symbol = row.loc['Symbol']
order_type = row.loc['Order']
shares_to_trade = row.loc['Shares']
current_cash, shares_owned, symbol_data = update_portfolio(symbol, order_type, shares_to_trade, current_cash,
shares_owned, symbol_data, current_date, end_date,
commission, impact)
else:
symbol = details.loc['Symbol']
order_type = details.loc['Order']
shares_to_trade = details.loc['Shares']
current_cash, shares_owned, symbol_data = update_portfolio(symbol, order_type, shares_to_trade, current_cash,
shares_owned, symbol_data, current_date, end_date,
commission, impact)
# Calculate portfolio value for the current date
portfolio_vals.loc[current_date]['Portfolio Value'] = calculate_portfolio_value(current_date, current_cash, shares_owned, symbol_data)
return portfolio_vals
def get_dates(orders_df):
order_dates = orders_df.index
start_date = orders_df.index[0]
end_date = orders_df.index[-1]
return start_date, end_date, order_dates
def update_portfolio(symbol, order_type, shares_to_trade, current_cash, shares_owned, symbol_data, current_date, end_date, commission_fee, market_impact):
if symbol not in symbol_data:
symbol_df = get_data([symbol], pd.date_range(current_date, end_date), addSPY=True, colname='Adj Close')
symbol_df = symbol_df.ffill().bfill()
symbol_data[symbol] = symbol_df
if order_type == 'BUY':
shares_change = shares_to_trade
cash_change = -symbol_data[symbol].loc[current_date][symbol] * (1 + market_impact) * shares_to_trade
elif order_type == 'SELL':
shares_change = -shares_to_trade
cash_change = symbol_data[symbol].loc[current_date][symbol] * (1 - market_impact) * shares_to_trade
shares_owned[symbol] = shares_owned.get(symbol, 0) + shares_change
current_cash += cash_change - commission_fee
return current_cash, shares_owned, symbol_data
def calculate_portfolio_value(current_date, current_cash, shares_owned, symbol_data):
shares_value = 0
for symbol in shares_owned:
shares_value += symbol_data[symbol].loc[current_date][symbol] * shares_owned[symbol]
return current_cash + shares_value
def test_code():
# This is a helper function you can use to test your code
# Note that during autograding, this function will not be called.
order_file = "./orders/orders-02.csv"
starting_val = 1000000
portfolio_values = compute_portvals(orders_file=order_file, start_val=starting_val)
print(portfolio_values)
if __name__ == "__main__":
test_code()
3.1 Getting Started This framework assumes you have already set up the local environment and ML4T Software. There is no distributed template for this project. You will have access to the ML4T/Data directory data, but you should use ONLY the API functions in util.py to read it. You may create a new folder called indicator_evaluation to contain your code for this project. You should create the following code files for submission. They should contain ALL code from you that is necessary to run your evaluations. indicators.py Code implementing your indicators as functions that operate on DataFrames. There is no defined API for indicators.py, but when it runs, the main method should generate the charts that will illustrate your indicators in the report. marketsimcode.py An improved version of your marketsim code accepts a "trades" DataFrame (instead of a file). More info on the trades data frame is below. It is OK not to submit this file if you have subsumed its functionality into one of your other required code files. This file has a different name and a slightly different setup than your previous project. However, that solution can be used with several edits for the new requirements. TheoreticallyOptimalStrategy.py Code implementing a TheoreticallyOptimalStrategy (details below). It should implement testPolicy(), which returns a trades data frame (see below). testproject.py This file should be considered the entry point to the project. The if "_name_" == "_main___": section of the code will call the testPolicy function in TheoreticallyOptimalStrategy, as well as your indicators and marketsimcode as needed, to generate the plots and statistics for your report (more details below).
Step by Step Solution
There are 3 Steps involved in it

Get step-by-step solutions from verified subject matter experts