

Question: i need help identifying the total cost to count only. the labor rate with fringes is all in the paragraph NOTE: The final ABC analysis
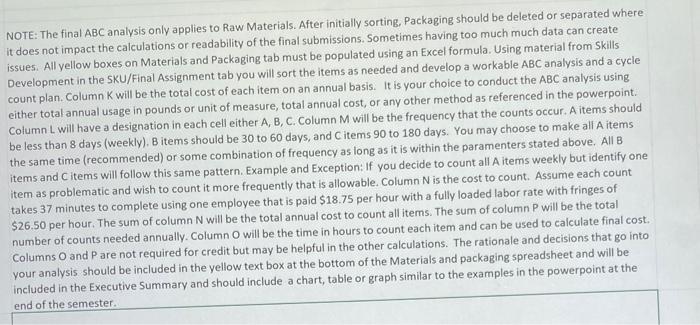
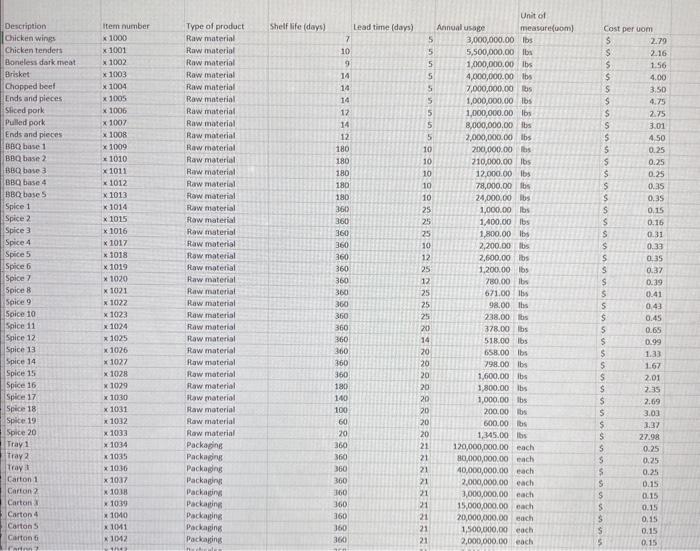
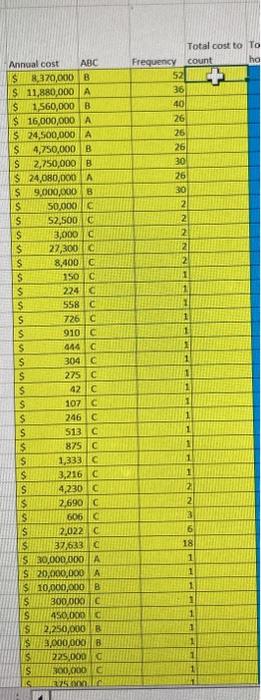
NOTE: The final ABC analysis only applies to Raw Materials. After initially sorting, Packaging should be deleted or separated where it does not impact the calculations or readability of the final submissions. Sometimes having too much much data can create issues. All yellow boxes on Materials and Packaging tab must be populated using an Excel formula. Using material from Skills Development in the SKU/Final Assignment tab you will sort the items as needed and develop a workable ABC analysis and a cycle count plan. Column K will be the total cost of each item on an annual basis. It is your choice to conduct the ABC analysis using either total annual usage in pounds or unit of measure, total annual cost, or any other method as referenced in the powerpoint. Column L will have a designation in each cell either A,B,C. Column M will be the frequency that the counts occur. A items should be less than 8 days (weekly), B items should be 30 to 60 days, and C items 90 to 180 days. You may choose to make all A items the same time (recommended) or some combination of frequency as long as it is within the paramenters stated above. All B items and C items will follow this same pattern. Example and Exception: If you decide to count all A items weekly but identify one item as problematic and wish to count it more frequently that is allowable. Column N is the cost to count. Assume each count takes 37 minutes to complete using one employee that is paid $18.75 per hour with a fully loaded labor rate with fringes of $26.50 per hour. The sum of column N will be the total annual cost to count all items. The sum of column P will be the total number of counts needed annually. Column O will be the time in hours to count each item and can be used to calculate final cost. Columns O and P are not required for credit but may be helpful in the other calculations. The rationale and decisions that go into your analysis should be included in the yellow text box at the bottom of the Materials and packaging spreadsheet and will be included in the Executive Summary and should include a chart, table or graph similar to the examples in the powerpoint at the
Step by Step Solution
There are 3 Steps involved in it

Get step-by-step solutions from verified subject matter experts