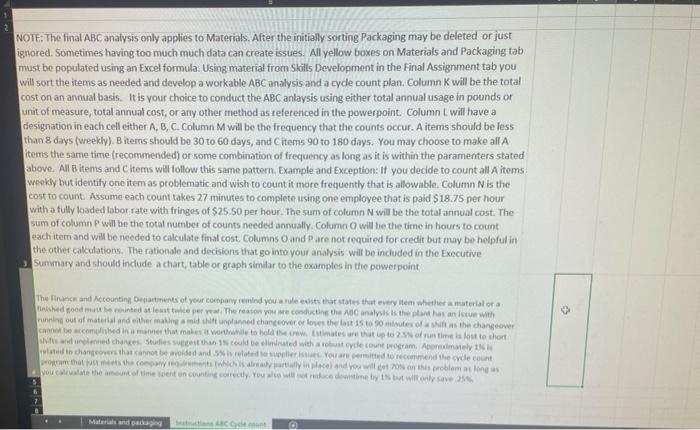
Question: NOTE: The final ABC analysis only applies to Materials. After the initially sorting Packaging may be deleted or just ignored. Sometimes having too much much

NOTE: The final ABC analysis only applies to
NOTE: The final ABC analysis only applies to Materials. After the initially sorting Packaging may be deleted or just ignored. Sometimes having too much much data can create issues. All yellow boxes on Materials and Packaging tab must be populated using an Excel formula. Using material from Skills Development in the Final Assignment tab you will sort the items as needed and develop a workable ABC analysis and a cyce count plan. Column K will be the total cost on an annual basis. It is your choice to conduct the ABC anlaysis using either total annual usage in pounds or unit of measure, total annual cost, or any other method as referenced in the powerpoint Column I will have a designation in each cell either A, B, C.Column M will be the frequency that the counts occur. A items should be less than 8 days (weekly). B items should be 30 to 60 days, and items 90 to 180 days. You may choose to make all A tems the same time (recommended) or some combination of frequency as long as it is within the paramenters stated above. All items and items will follow this same pattern. Example and Exception: If you decide to count all items weekly but identify one item as problematic and wish to count it more frequently that is allowable Column N is the cost to count. Assumo each count takes 27 minutes to complete using one employee that is paid $18.75 per hour with a fully loaded labor rate with fringes of $25.50 per hour. The sum of column N will be the total annual cost. The sum of column will be the total number of counts needed annually. Column will be the time in hours to count each item and will be needed to calculate final cost. Columns and are not required for credit but may be helpful in the other calculations. The rationale and decisions that go into your analysis will be included in the Executive Summary and should include a chart, table or graph similar to the oxamples in the powerpoint The face and Accounting Departments of your company remind you are the states that every item whether material or a Tinished good muredeste per a The reason you are conducting the analysis is the plant has an ist with running out of material and either making a mid til planned changeover or loses the cost 15 to 20 minutes of the change can be accombed in a manner that makes it worth to hold the states that up to 2 of run time is lost te short and red chance Studies that could be eated with a robust de cont program, Arimately di hangovers that cannot be led and stowwe. You need to recommend the code cont that which is why and you will problemas long as you call the amount of time sent un conte correctly. You wie diety but will only save N LM We AN 100 Dhe 100 L 18 14 10 3 1 er um 0.0 NOTE: The final ABC analysis only applies to Materials. After the initially sorting Packaging may be deleted or just ignored. Sometimes having too much much data can create issues. All yellow boxes on Materials and Packaging tab must be populated using an Excel formula. Using material from Skills Development in the Final Assignment tab you will sort the items as needed and develop a workable ABC analysis and a cyce count plan. Column K will be the total cost on an annual basis. It is your choice to conduct the ABC anlaysis using either total annual usage in pounds or unit of measure, total annual cost, or any other method as referenced in the powerpoint Column I will have a designation in each cell either A, B, C.Column M will be the frequency that the counts occur. A items should be less than 8 days (weekly). B items should be 30 to 60 days, and items 90 to 180 days. You may choose to make all A tems the same time (recommended) or some combination of frequency as long as it is within the paramenters stated above. All items and items will follow this same pattern. Example and Exception: If you decide to count all items weekly but identify one item as problematic and wish to count it more frequently that is allowable Column N is the cost to count. Assumo each count takes 27 minutes to complete using one employee that is paid $18.75 per hour with a fully loaded labor rate with fringes of $25.50 per hour. The sum of column N will be the total annual cost. The sum of column will be the total number of counts needed annually. Column will be the time in hours to count each item and will be needed to calculate final cost. Columns and are not required for credit but may be helpful in the other calculations. The rationale and decisions that go into your analysis will be included in the Executive Summary and should include a chart, table or graph similar to the oxamples in the powerpoint The face and Accounting Departments of your company remind you are the states that every item whether material or a Tinished good muredeste per a The reason you are conducting the analysis is the plant has an ist with running out of material and either making a mid til planned changeover or loses the cost 15 to 20 minutes of the change can be accombed in a manner that makes it worth to hold the states that up to 2 of run time is lost te short and red chance Studies that could be eated with a robust de cont program, Arimately di hangovers that cannot be led and stowwe. You need to recommend the code cont that which is why and you will problemas long as you call the amount of time sent un conte correctly. You wie diety but will only save N LM We AN 100 Dhe 100 L 18 14 10 3 1 er um 0.0

Step by Step Solution

There are 3 Steps involved in it

1 Expert Approved Answer
Step: 1 Unlock blur-text-image
Question Has Been Solved by an Expert!

Get step-by-step solutions from verified subject matter experts

Step: 2 Unlock
Step: 3 Unlock

Students Have Also Explored These Related General Management Questions!