

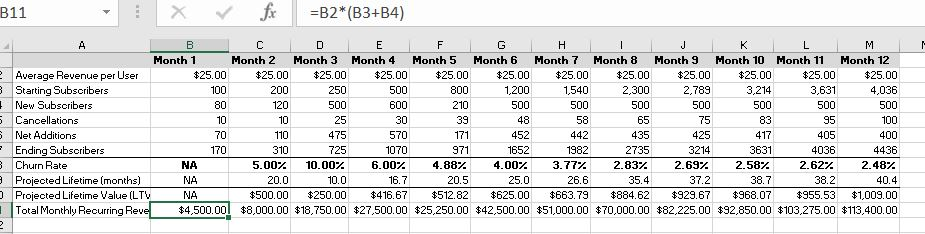
Question: I need help in interpreting/summarizing this graph based on forecasting annual sales for a subscription-based model: B11 =B2*(B3+B4) B C D E F G H
I need help in interpreting/summarizing this graph based on forecasting annual sales for a subscription-based model:
Step by Step Solution
There are 3 Steps involved in it
1 Expert Approved Answer
Step: 1 Unlock

Question Has Been Solved by an Expert!
Get step-by-step solutions from verified subject matter experts
Step: 2 Unlock
Step: 3 Unlock