

Question: I need help in this activity, you will draw a scatter plot and the line of best fit to analyze a situation. jeremy is on
I need help
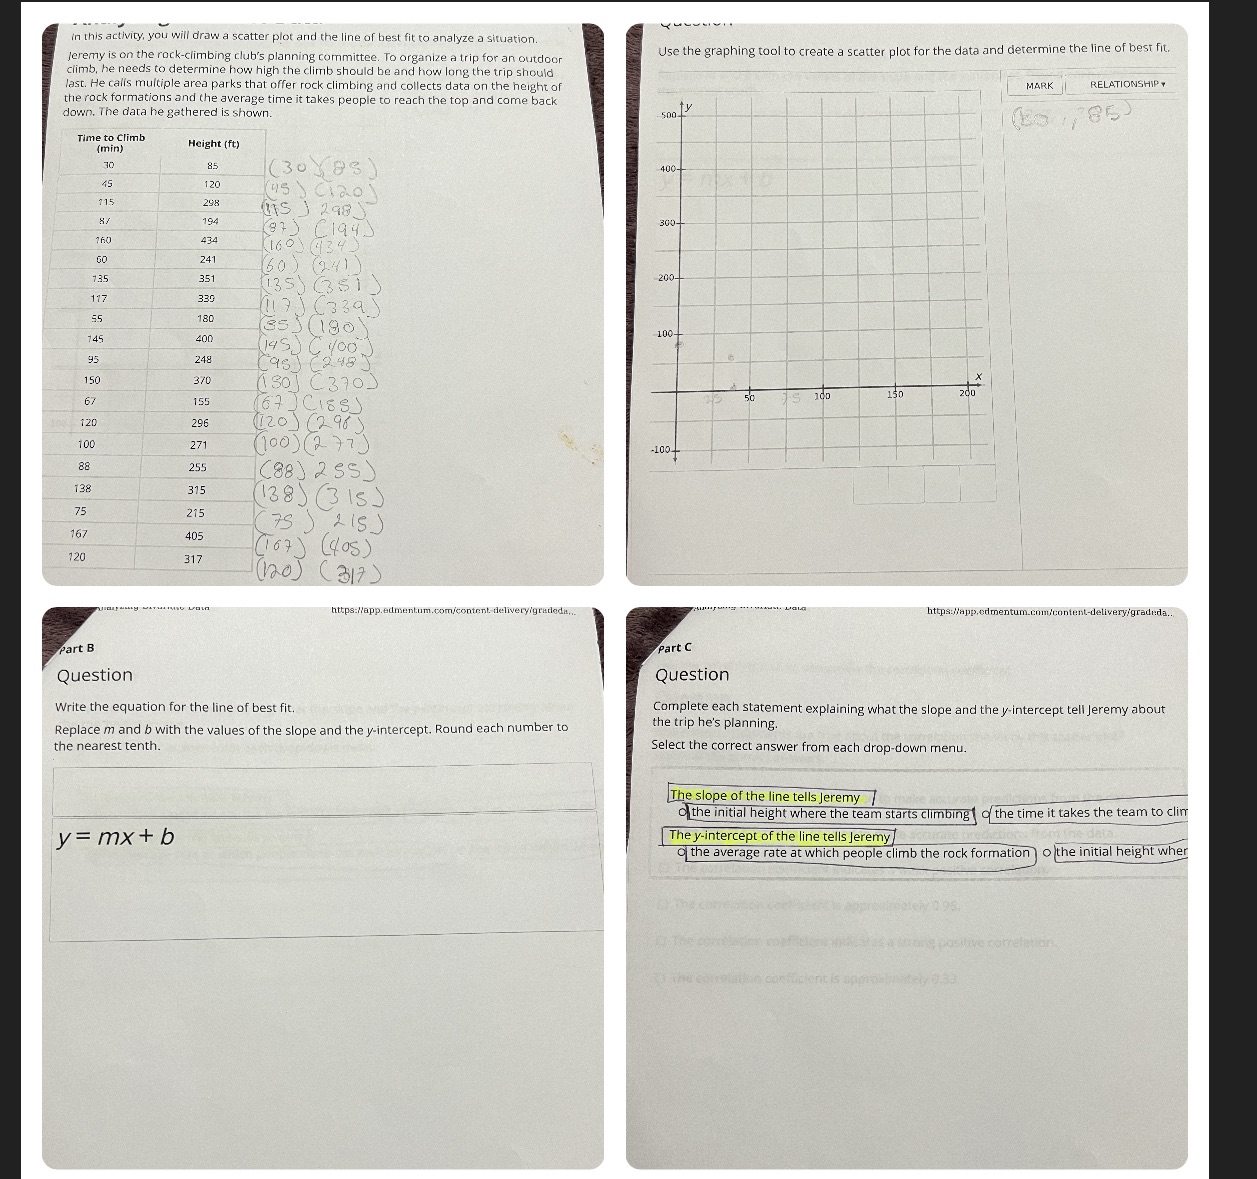
in this activity, you will draw a scatter plot and the line of best fit to analyze a situation. jeremy is on the rock-climbing club's planning committee. To organize a trip for an outdoor Ise the graphing tool to create a scatter plot for the data and determine the line of best fit. climb, he needs to determine how high the climb should be and how long the trip should last. He calls multiple area parks that offer rock climbing and collects data on the height of MARK RELATIONSHIP. the rock formations and the average time it takes people to reach the top and come back down. The data he gathered is shown. Time to Climb (min) Height (ft) 85 ( 30 ) 83 ) 100- 45 120 715 298 (15 ) Ciao ) 194 300- 434 1603 434 241 135 351 (60 ) (941 ) 200- 117 335 (35) (67 ) 180 745 35) (190) 400 100- (195 )( 248 370 50 10 0 150 2do 155 ( 67 ] Ciss ) 120 296 (120) ( 2 96 ) 100 271 (100) ( 27 7 ) -100 88 255 (88 ) 295) 138 315 75 (138 ) ( 3 1s) 215 167 ( 75 ) 215 405 120 ( 167 ) ( fos ) 317 (120 ) ( 317 ) https:/app. edmentum.com/content. delivery/gratleda,.. https:/app.edmentum.com/content-delivery/gradeda. part art C Question Question Write the equation for the line of best fit. Complete each statement explaining what the slope and the y-intercept tell Jeremy about Replace m and b with the values of the slope and the y-intercept. Round each number to the trip he's planning. the nearest tenth. Select the correct answer from each drop-down menu. The slope of the line tells Jeremy 7 the initial height where the team starts climbing ( of the time it takes the team to clim y = mx+ b The y-intercept of the line tells Jeremy the average rate at which people climb the rock formation ) o the initial height when
Step by Step Solution
There are 3 Steps involved in it

Get step-by-step solutions from verified subject matter experts