Question: I need help in this question. Please do it correctly and 100%. Please show me the formulas or methods so i can follow it, please
I need help in this question. Please do it correctly and 100%. Please show me the formulas or methods so i can follow it, please do it as the excel sheets are to make it easy. I will be very thankful
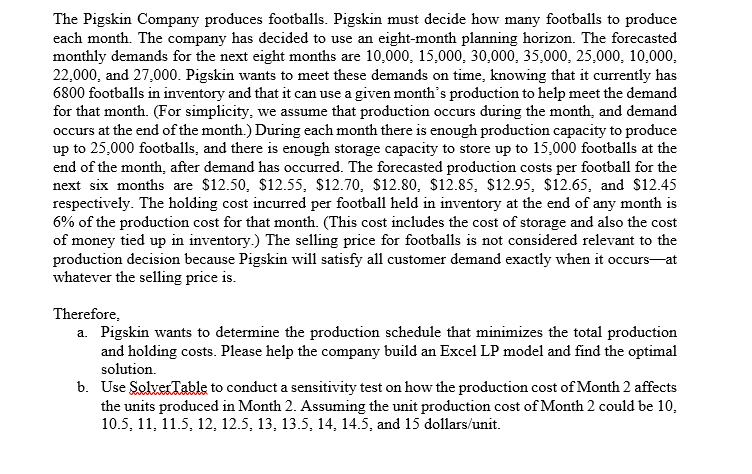
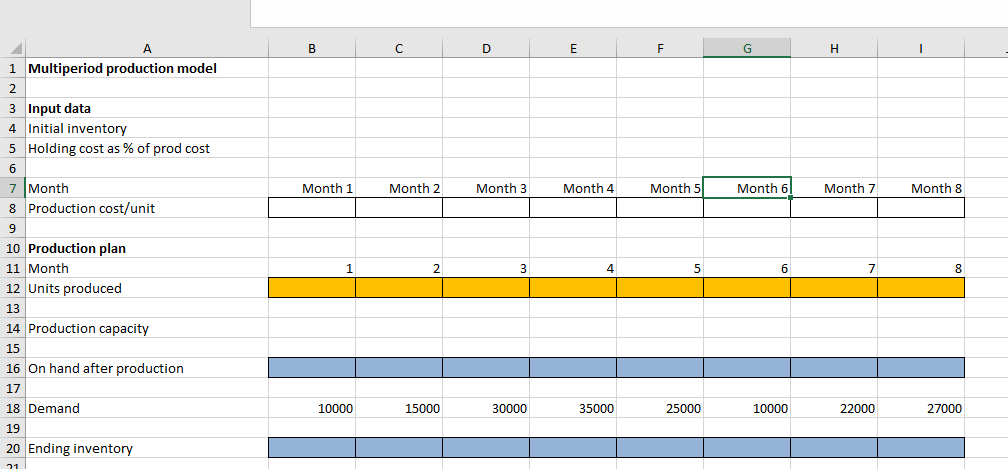
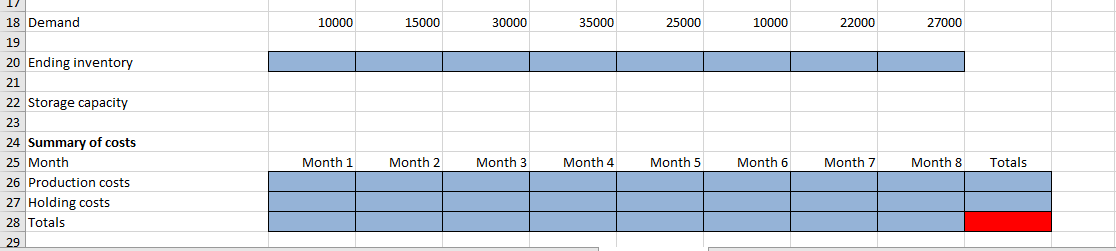
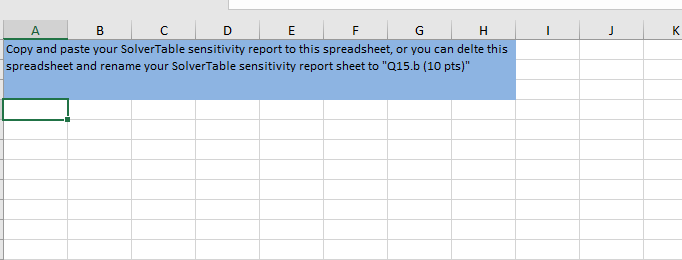
The Pigskin Company produces footballs. Pigskin must decide how many footballs to produce each month. The company has decided to use an eight-month planning horizon. The forecasted monthly demands for the next eight months are 10,000, 15,000, 30,000, 35,000, 25.000, 10,000, 22,000, and 27,000. Pigskin wants to meet these demands on time, knowing that it currently has 6800 footballs in inventory and that it can use a given month's production to help meet the demand for that month. (For simplicity, we assume that production occurs during the month and demand occurs at the end of the month.) During each month there is enough production capacity to produce up to 25,000 footballs, and there is enough storage capacity to store up to 15,000 footballs at the end of the month, after demand has occurred. The forecasted production costs per football for the next six months are $12.50, $12.55, $12.70, $12.80, $12.85, $12.95, $12.65, and $12.45 respectively. The holding cost incurred per football held in inventory at the end of any month is 6% of the production cost for that month. (This cost includes the cost of storage and also the cost of money tied up in inventory.) The selling price for footballs is not considered relevant to the production decision because Pigskin will satisfy all customer demand exactly when it occurs at whatever the selling price is. Therefore, a. Pigskin wants to determine the production schedule that minimizes the total production and holding costs. Please help the company build an Excel LP model and find the optimal solution. b. Use Solver Iable to conduct a sensitivity test on how the production cost of Month 2 affects the units produced in Month 2. Assuming the unit production cost of Month 2 could be 10, 10.5. 11. 11.5. 12. 12.5, 13, 13.5, 14, 14.5, and 15 dollars/unit. B D F G H Month 1 Month 2 Month 3 Month 4 Month 5 Month 6 Month 7 Month 8 1 Multiperiod production model 2 3 Input data 4 Initial inventory 5 Holding cost as % of prod cost 6 7 Month 8 Production cost/unit 9 10 Production plan 11 Month 12 Units produced 13 14 Production capacity 2 3 4 5 6 7 8 15 16 On hand after production 17 18 Demand 19 20 Ending inventory 10000 15000 30000 35000 25000 10000 22000 27000 21 10000 15000 30000 35000 25000 10000 22000 27000 18 Demand 19 20 Ending inventory 21 22 Storage capacity 23 24 Summary of costs 25 Month 26 Production costs 27 Holding costs 28 Totals Month 1 Month 2 Month 3 Month 4 Month 5 Month 6 Month 7 Month 8 Totals 29 J A B Ico E F G H Copy and paste your SolverTable sensitivity report to this spreadsheet, or you can delte this spreadsheet and rename your SolverTable sensitivity report sheet to "Q15.b (10 pts)


