

Question: I need help with this question. Please do it in excel and please show the formulas of the work. * for the drop downs it's
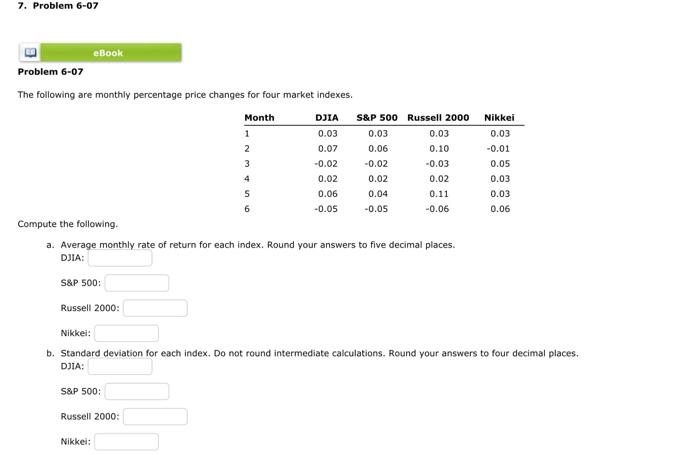
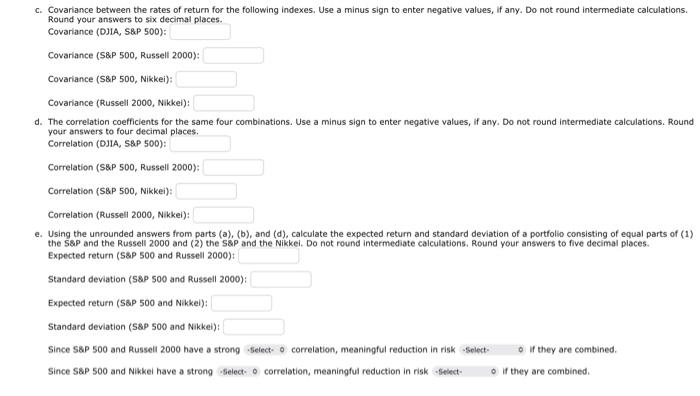
The following are monthly percentage price changes for four market indexes. Compute the following. a. Average monthly rate of return for each index. Round your answers to five decimal places. DIIA: S\&P 500: Russell 2000: Nikkei: b. Standard deviation for each index. Do not round intermediate calculations. Round your answers to four decimal places. DJIA: S\&P 500: Russell 2000: Nikkei: c. Covariance between the rates of return for the following indexes. Use a minus sign to enter negative values, if any. Do not round intermediate calculations. Round your answers to six decimal places. Covariance (DJIA, S\&P 500): Covariance (S\&P 500, Russell 2000): Covariance (S\&P 500, Nikkei): Covariance (Russeli 2000, Nikkei): d. The correlation coefficients for the same four combinations. Use a minus sign to enter negative values, if any, Do not round intermediate calculations. Round your answers to four decimal places. Correlation (DJIA, S\&P 500): Correlation (S\&P 500, Russell 2000): Correlation (S\&P 500, Nikkei): Correlation (Russell 2000, Nikkei): e. Using the unrounded answers from parts (a), (b), and (d), calculate the expected return and standard deviation of a portfolio consisting of equal parts of (1) the S\&P and the Russell 2000 and (2) the S\&P and the Nikkei. Do not round intermediate calculations. Round your answers to five decimal places. Expected return (S\$P 500 and Russell 2000): Standard deviation (S8P 500 and Russell 2000): Expected return (S\&P 500 and Nikkei): Standard deviation (S\&P 500 and Nikkei): Since S8P 500 and Russell 2000 have a strong Since S\&P 500 and Nikkei have a strong correlation, meaningful reduction in risk correlation, meaningful reduction in risk if they are combined. If they are combined
Step by Step Solution
There are 3 Steps involved in it

Get step-by-step solutions from verified subject matter experts