

Question: I need help interpreting my results! 1) The standard deviation is 8.39 for stock return. The standard deviation 8.80 for market return. Is your stock
I need help interpreting my results!
1) The standard deviation is 8.39 for stock return. The standard deviation 8.80 for market return. Is your stock more volatile than the stock market in general? If so, why do you think it is more volatile than the market?
2) Assume that the average risk-free rate is 4.13%. Determine the Sharpe and Treynor index for your stock.
The Sharpe Indexis 0.1634 for stock return. The Sharpe Index-0.610 for market return.
The Treynor Index is 0.0391 for stock return. The Treynor Index-0.153 for market return.
Interpret both indices.
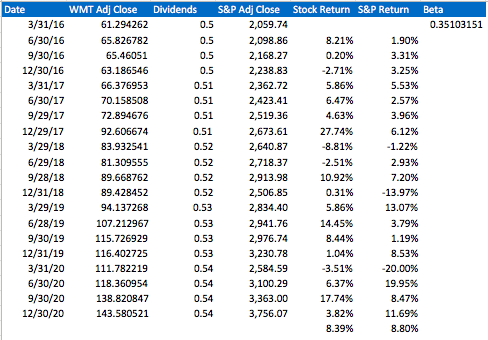
Date WMT Adj Close 3/31/16 61.294262 6/30/16 65.826782 9/30/16 65.46051 12/30/16 63.186546 3/31/17 66.376953 6/30/17 70.158508 9/29/17 72.894676 12/29/17 92.606674 3/29/18 83.932541 6/29/18 81.309555 9/28/18 89.668762 12/31/18 89.428452 3/29/19 94.137268 6/28/19 107.212967 9/30/19 115.726929 12/31/19 116.402725 3/31/20 111.782219 6/30/20 118.360954 9/30/20 138.820847 12/30/20 143.580521 Dividends S&P Adj Close 0.5 2,059.74 0.5 2,098.86 0.5 2,168.27 0.5 2,238.83 0.51 2,362.72 0.51 2,423.41 0.51 2,519.36 0.51 2,673.61 0.52 2,640.87 0.52 2,718.37 0.52 2,913.98 0.52 2,506.85 0.53 2,834.40 0.53 2,941.76 0.53 2,976.74 0.53 3,230.78 0.54 2,584.59 0.54 3,100.29 0.54 3,363.00 0.54 3,756.07 Stock Return S&P Return Beta 0.35103151 8.21% 1.90% 0.20% 3.31% -2.71% 3.25% 5.86% 5.53% 6.47% 2.57% 4.63% 3.96% 27.74% 6.12% -8.81% -1.22% -2.51% 2.93% 10.92% 7.20% 0.31% -13.97% 5.86% 13.07% 14.45% 3.79% 8.44% 1.19% 1.04% 8.53% -3.51% -20.00% 6.37% 19.95% 17.74% 8.47% 3.82% 11.69% 8.39% 8.80% Date WMT Adj Close 3/31/16 61.294262 6/30/16 65.826782 9/30/16 65.46051 12/30/16 63.186546 3/31/17 66.376953 6/30/17 70.158508 9/29/17 72.894676 12/29/17 92.606674 3/29/18 83.932541 6/29/18 81.309555 9/28/18 89.668762 12/31/18 89.428452 3/29/19 94.137268 6/28/19 107.212967 9/30/19 115.726929 12/31/19 116.402725 3/31/20 111.782219 6/30/20 118.360954 9/30/20 138.820847 12/30/20 143.580521 Dividends S&P Adj Close 0.5 2,059.74 0.5 2,098.86 0.5 2,168.27 0.5 2,238.83 0.51 2,362.72 0.51 2,423.41 0.51 2,519.36 0.51 2,673.61 0.52 2,640.87 0.52 2,718.37 0.52 2,913.98 0.52 2,506.85 0.53 2,834.40 0.53 2,941.76 0.53 2,976.74 0.53 3,230.78 0.54 2,584.59 0.54 3,100.29 0.54 3,363.00 0.54 3,756.07 Stock Return S&P Return Beta 0.35103151 8.21% 1.90% 0.20% 3.31% -2.71% 3.25% 5.86% 5.53% 6.47% 2.57% 4.63% 3.96% 27.74% 6.12% -8.81% -1.22% -2.51% 2.93% 10.92% 7.20% 0.31% -13.97% 5.86% 13.07% 14.45% 3.79% 8.44% 1.19% 1.04% 8.53% -3.51% -20.00% 6.37% 19.95% 17.74% 8.47% 3.82% 11.69% 8.39% 8.80%
Step by Step Solution
There are 3 Steps involved in it

Get step-by-step solutions from verified subject matter experts