

Question: I need help making a graph for this and the questions. Graph and interpret motion data of a moving object Activity 1. Table 1 Time
I need help making a graph for this and the questions.
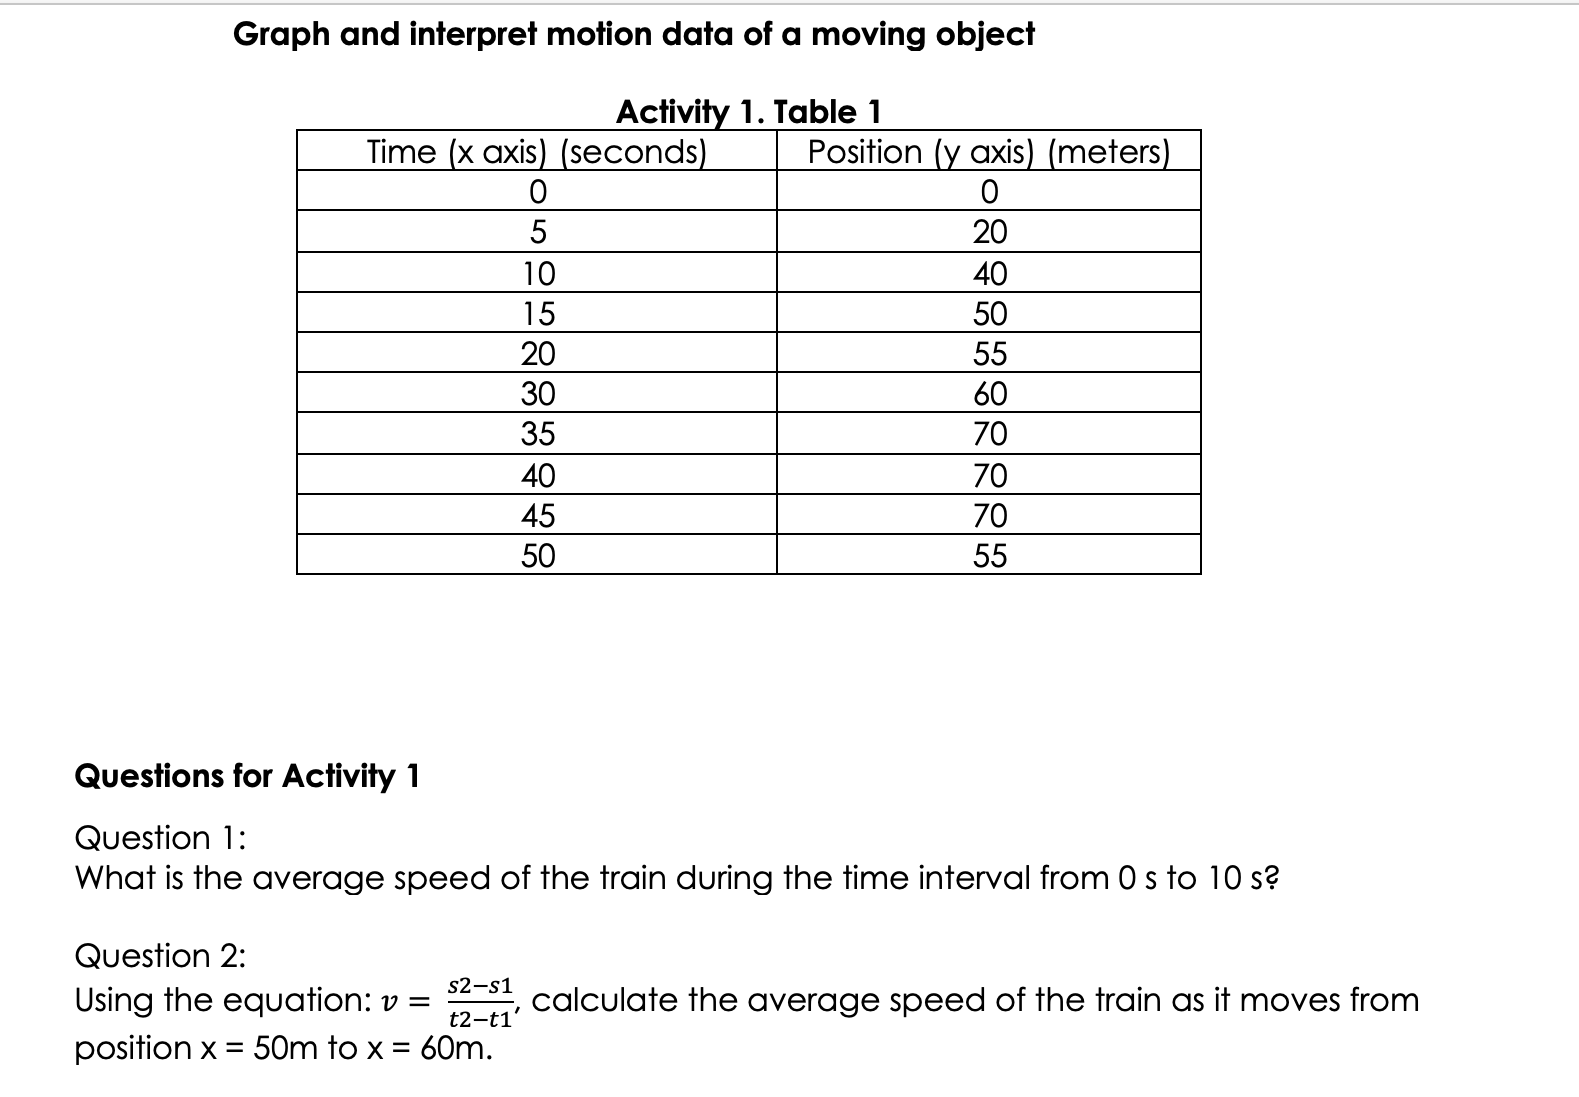
Graph and interpret motion data of a moving object Activity 1. Table 1 Time (x axis) (seconds) Position (y axis) (meters) 0 0 5 20 10 40 15 50 20 55 30 50 35 70 40 70 45 70 50 55 Questions for Activity 1 Question 1: What is the average speed of the train during the time interval from 0 s to 10 s? Question 2: Using the equation: v = $2-$1 12-+1. calculate the average speed of the train as it moves from position x = 50m to x = 60m
Step by Step Solution
There are 3 Steps involved in it
1 Expert Approved Answer
Step: 1 Unlock

Question Has Been Solved by an Expert!
Get step-by-step solutions from verified subject matter experts
Step: 2 Unlock
Step: 3 Unlock