

Question: I need help on a statistic problem and this problem is based on Double Exponential Smoothing Model. Section 16.3 Homework-Eliyah Atkins - Google Chrome X
I need help on a statistic problem and this problem is based on Double Exponential Smoothing Model.
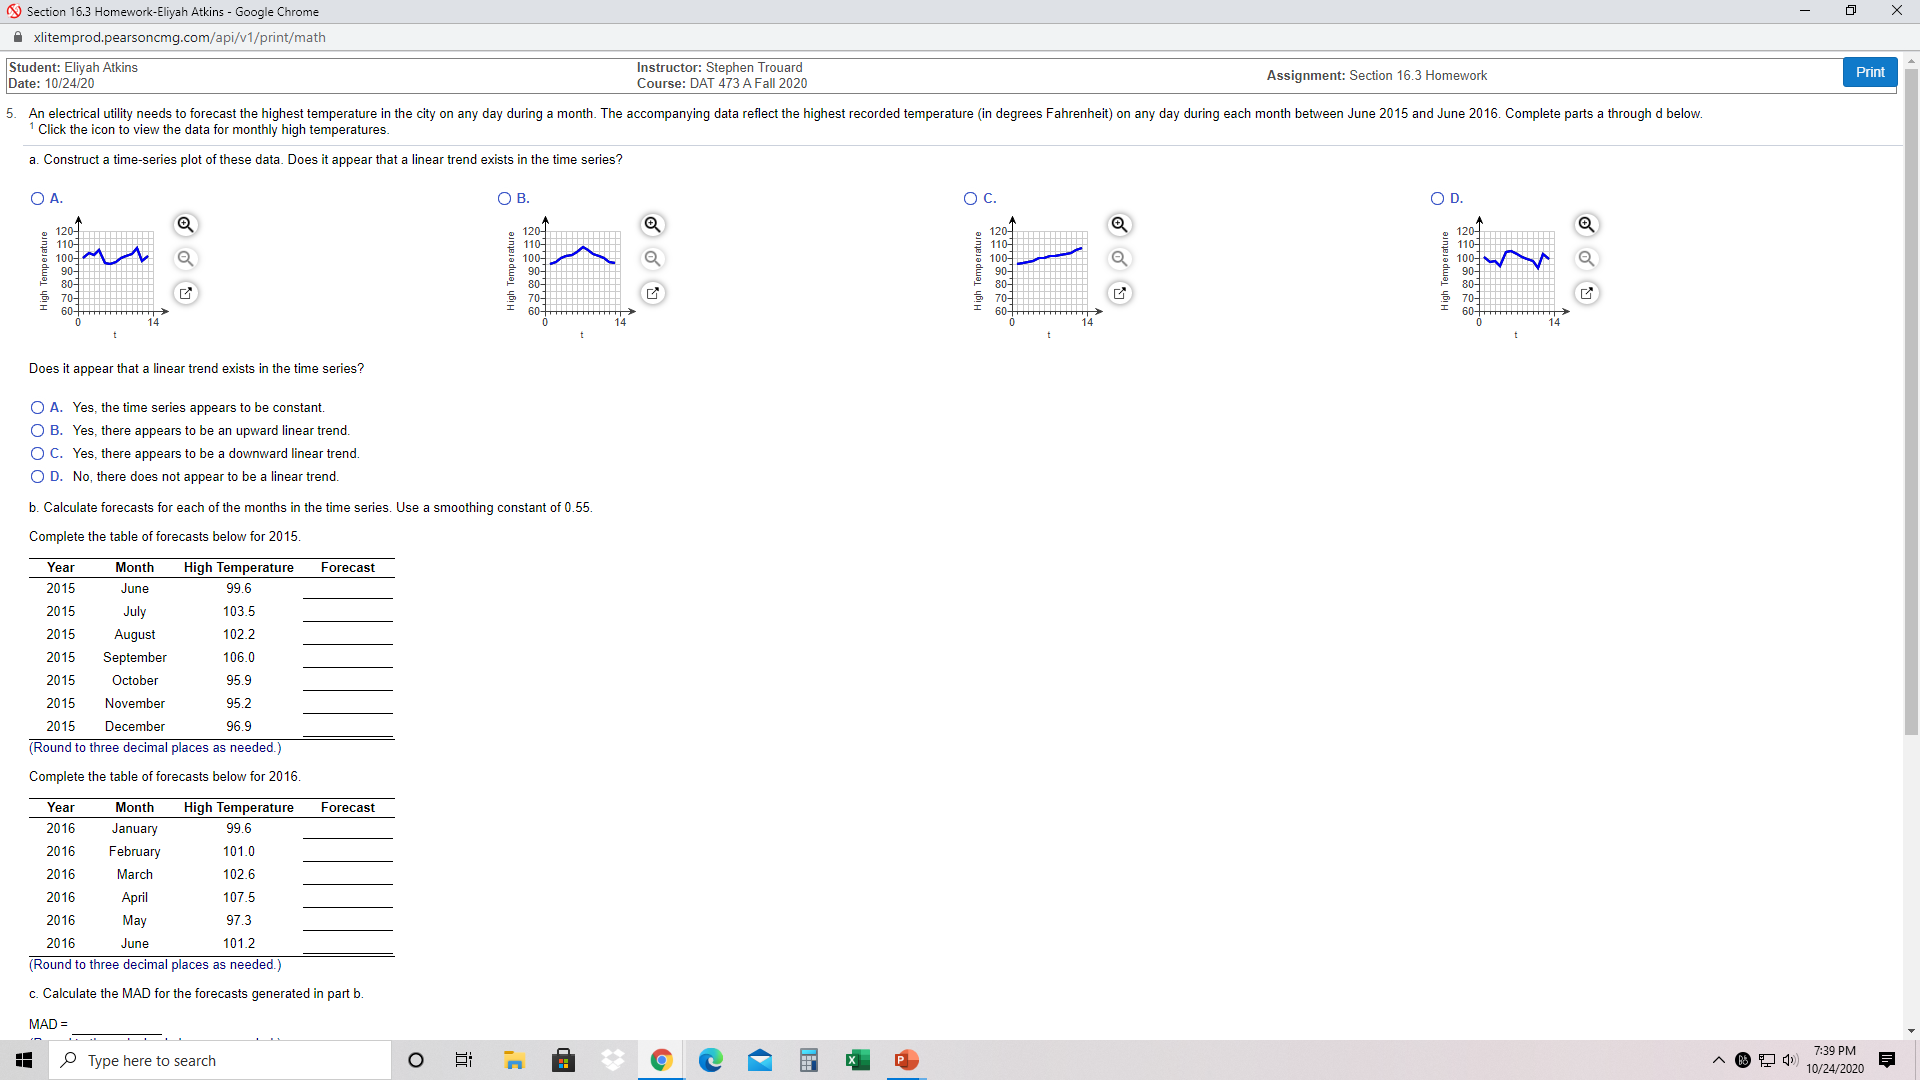
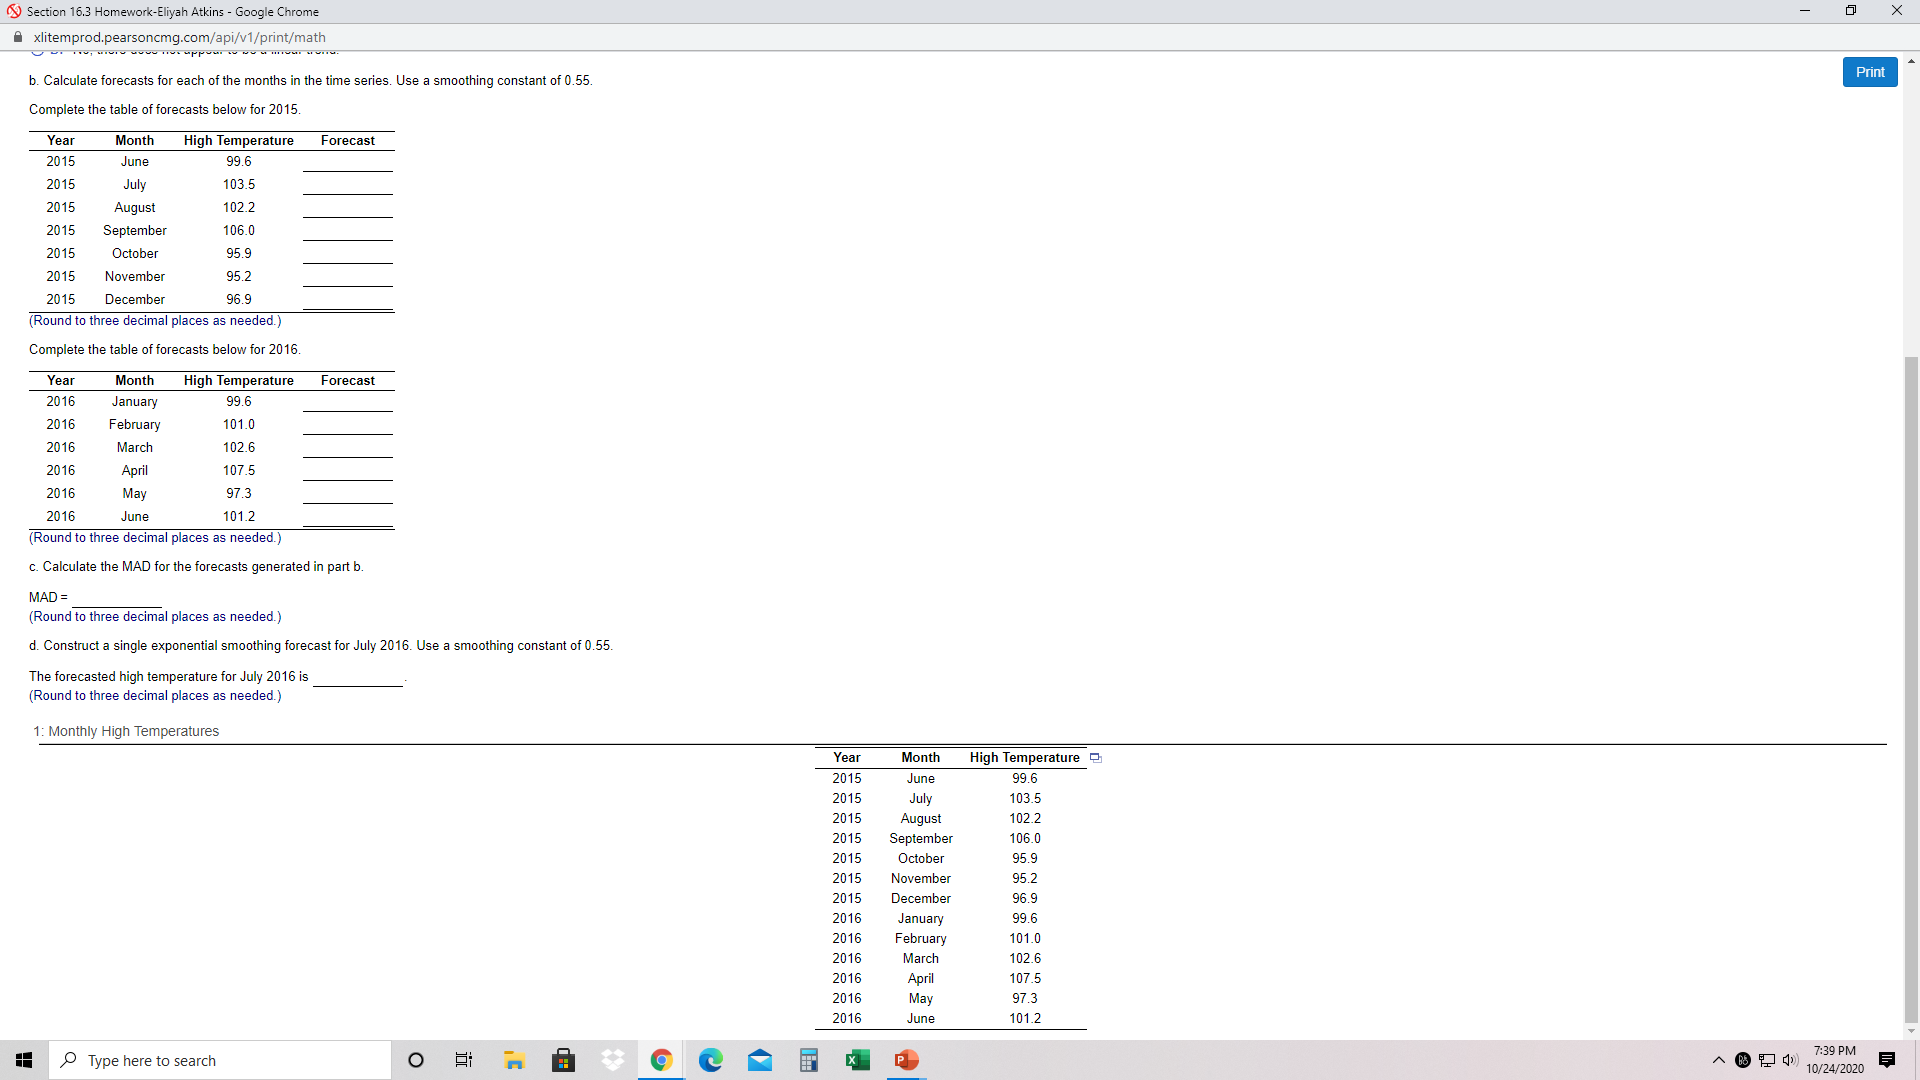
Section 16.3 Homework-Eliyah Atkins - Google Chrome X xlitemprod.pearsoncmg.com/api/v1/print/math Student: Eliyah Atkins Instructor: Stephen Trouard Assignment: Section 16.3 Homework Print Date: 10/24/20 Course: DAT 473 A Fall 2020 5. An electrical utility needs to forecast the highest temperature in the city on any day during a month. The accompanying data reflect the highest recorded temperature (in degrees Fahrenheit) on any day during each month between June 2015 and June 2016. Complete parts a through d below. Click the icon to view the data for monthly high temperatures a. Construct a time-series plot of these data. Does it appear that a linear trend exists in the time series? O A. O B. O C. OD 120- High Temperature 120- 110- 120- 110- 120- 110- 100- O 100- 110- 100- 90- O - 80- 90- High 80- 70 60- High Temperature 60 High Temperature Does it appear that a linear trend exists in the time series? O A. Yes, the time series appears to be constant O B. Yes, there appears to be an upward linear trend. O C. Yes, there appears to be a downward linear trend. O D. No, there does not appear to be a linear trend b. Calculate forecasts for each of the months in the time series. Use a smoothing constant of 0.55. Complete the table of forecasts below for 2015 Year Month High Temperature Forecast 2015 June 99.6 2015 July 103.5 2015 August 102.2 2015 September 106.0 2015 October 95.9 2015 November 95.2 2015 December 96.9 (Round to three decimal places as needed.) Complete the table of forecasts below for 2016. Year Month High Temperature Forecast 2016 January 99.6 2016 February 101.0 2016 March 102.6 2016 April 107.5 2016 May 97.3 2016 June 101.2 (Round to three decimal places as needed.) c. Calculate the MAD for the forecasts generated in part b. MAD = Type here to search O 7:39 PM 10/24/2020X Section 16.3 Homework-Eliyah Atkins - Google Chrome Axlitemprod.pearsoncmg.com/api/v1/print/math Print b. Calculate forecasts for each of the months in the time series. Use a smoothing constant of 0.55 Complete the table of forecasts below for 2015 Year Month High Temperature Forecast 2015 June 99.6 2015 July 103.5 2015 August 102.2 2015 September 106.0 2015 October 95.9 2015 November 95.2 2015 December 96.9 (Round to three decimal places as needed.) Complete the table of forecasts below for 2016. Year Month High Temperature Forecast 2016 January 99.6 2016 February 101.0 2016 March 102.6 2016 April 107.5 2016 May 97.3 2016 June 101.2 (Round to three decimal places as needed.) c. Calculate the MAD for the forecasts generated in part b. MAD = (Round to three decimal places as needed.) d. Construct a single exponential smoothing forecast for July 2016. Use a smoothing constant of 0.55. The forecasted high temperature for July 2016 is (Round to three decimal places as needed.) I: Monthly High Temperatures Year Month High Temperature 2015 June 99.6 015 July 103.5 2015 August 102.2 2015 September 106.0 2015 October 95.9 2015 November 95 2 2015 December 96.9 2016 January 99.6 2016 February 101.0 2016 March 102.6 2016 April 107.5 2016 May 97.3 2016 June 101.2 7:39 PM Type here to search O 10/24/2020
Step by Step Solution
There are 3 Steps involved in it

Get step-by-step solutions from verified subject matter experts