

Question: Need some help on a few of these stats problems 1. Section 12.3 Homework-Eliyah Atkins - Google Chrome X xlitemprod.pearsoncmg.com/api/v1/print/math Student: Eliyah Atkins Instructor: Stephen
Need some help on a few of these stats problems
1.
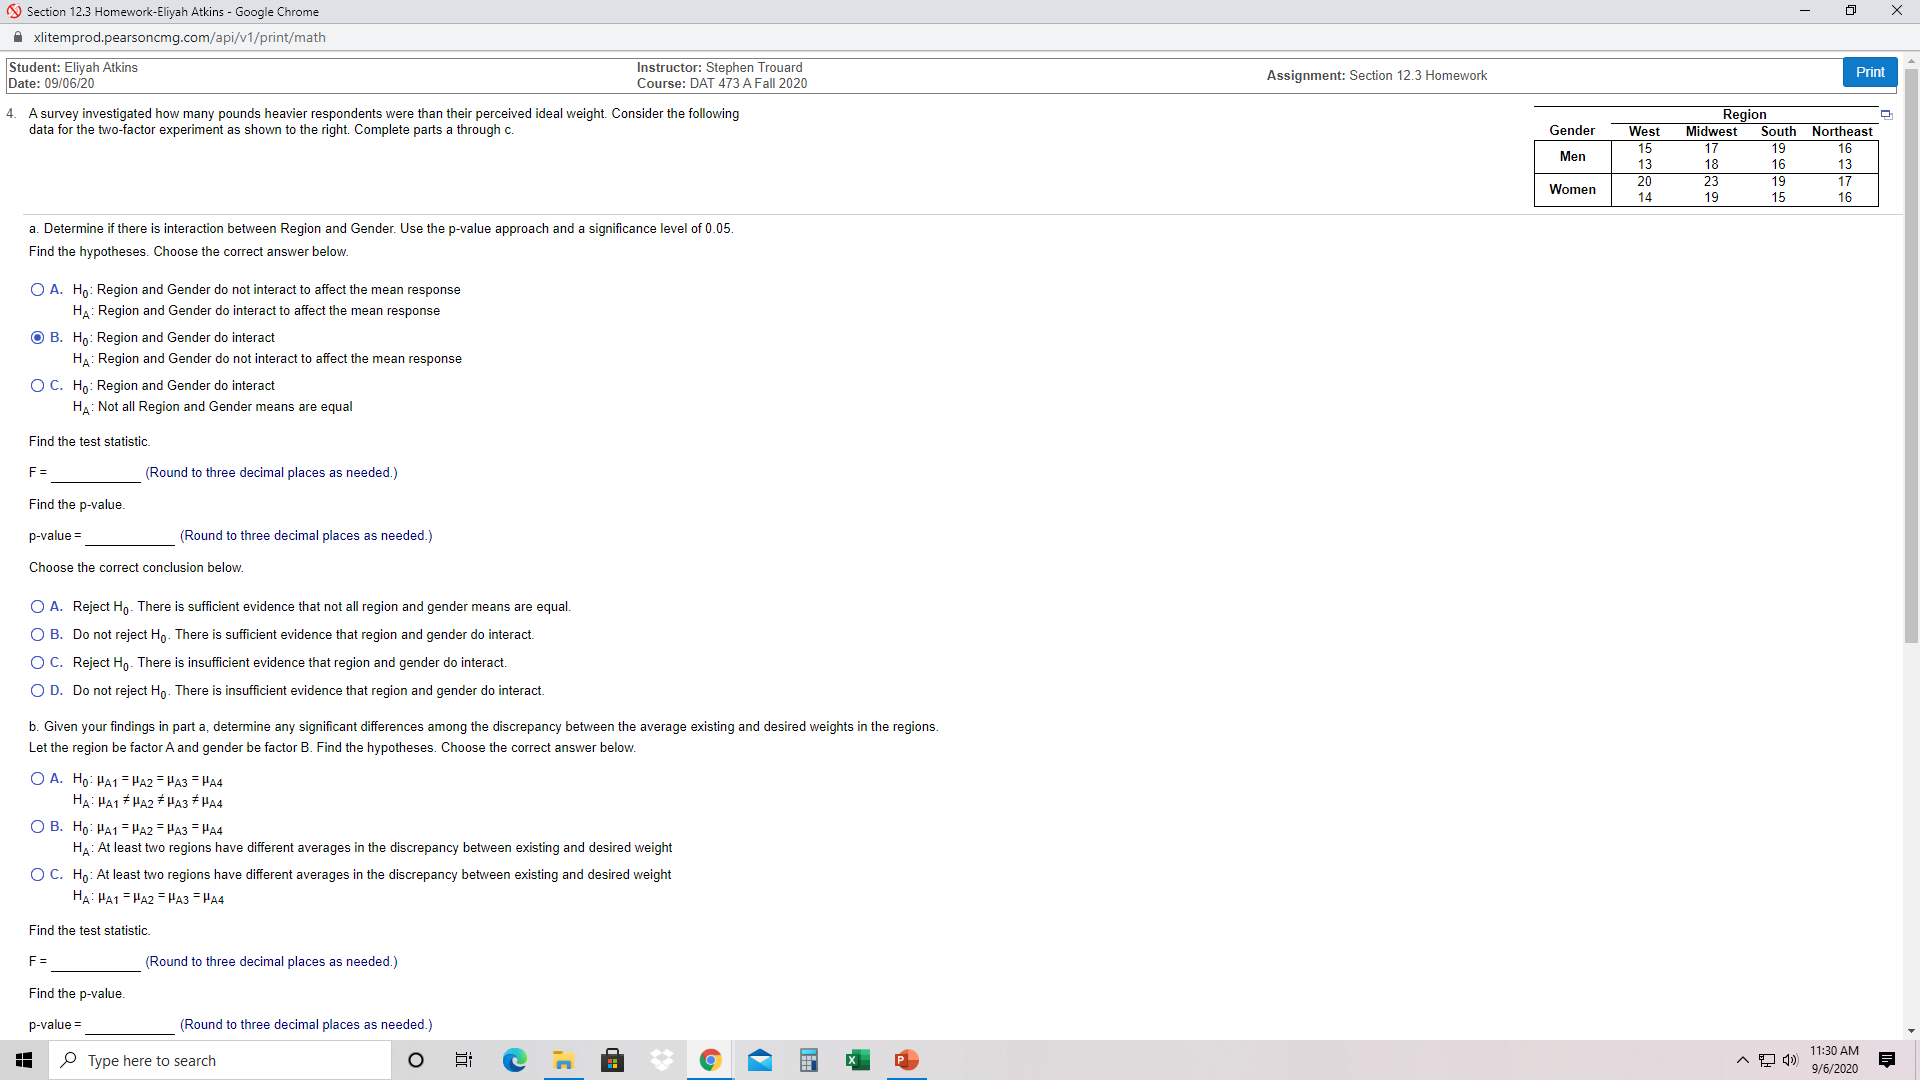
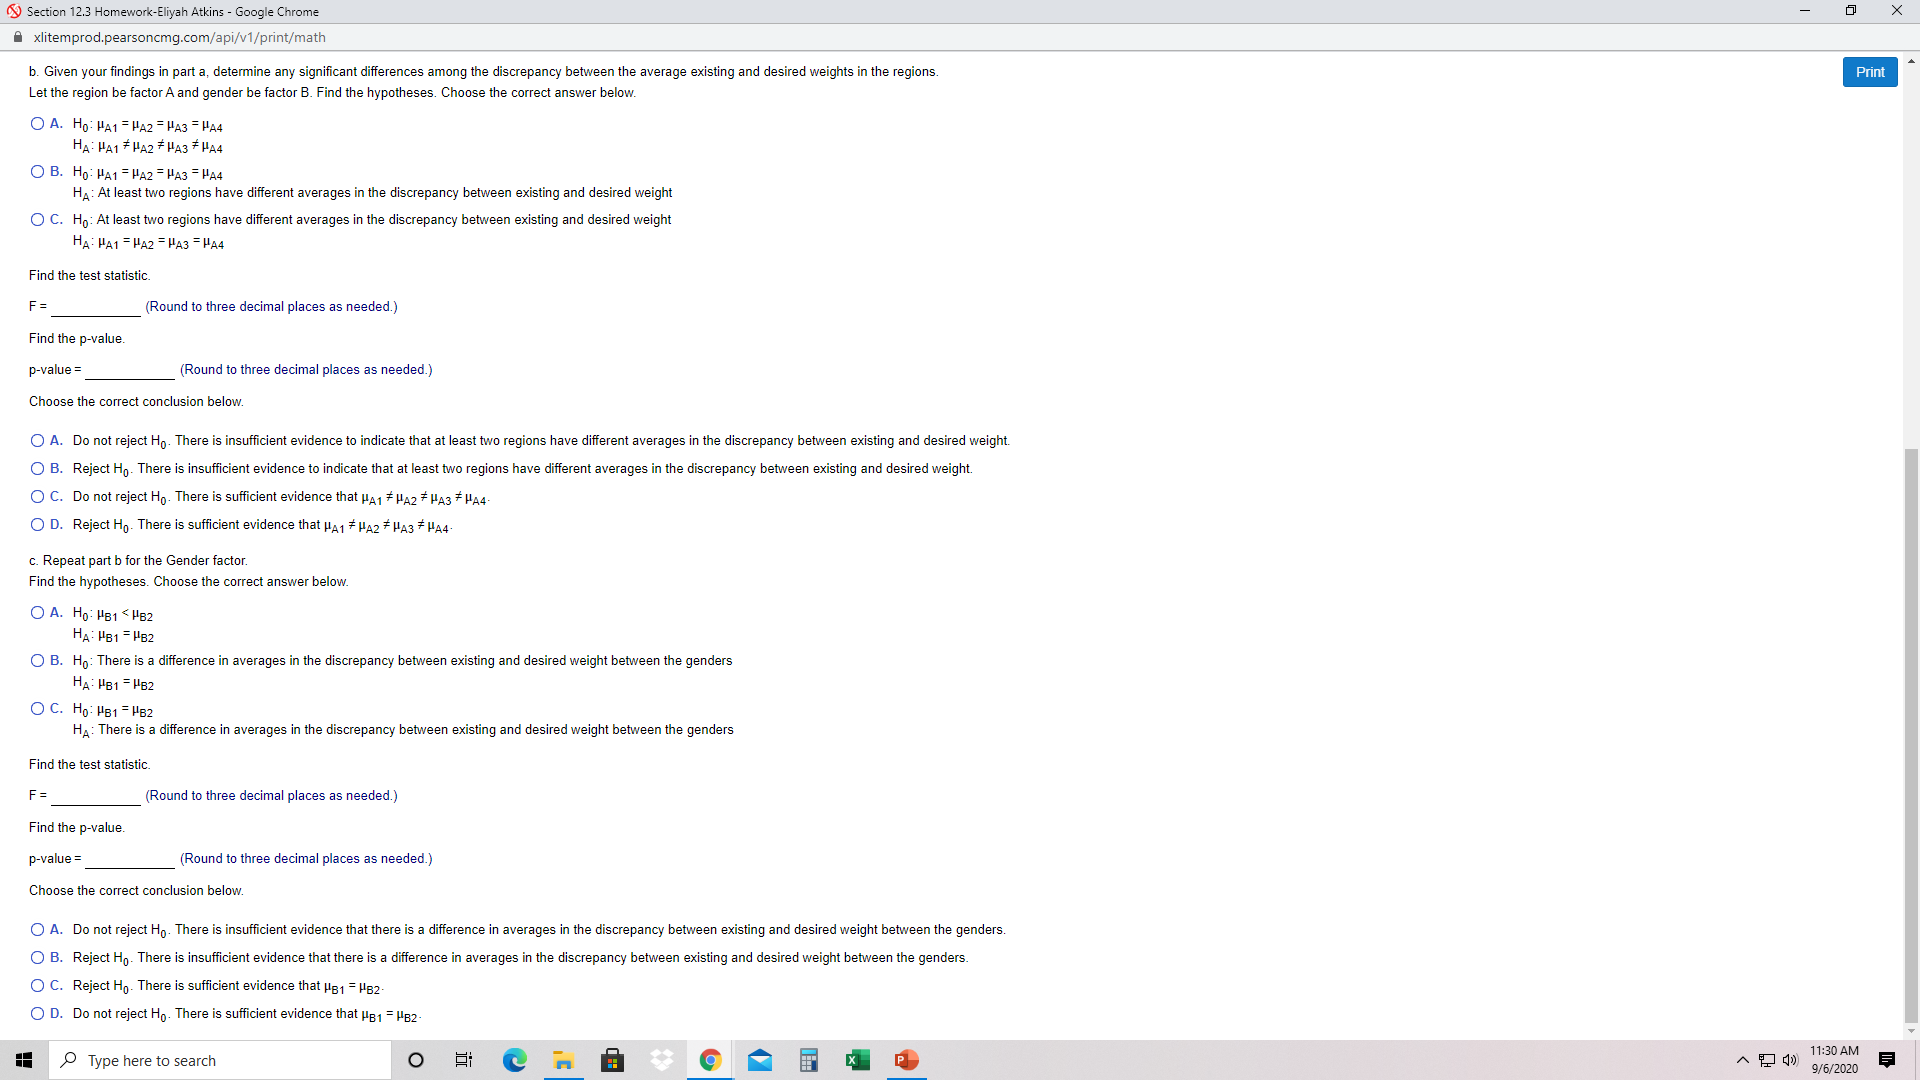
Section 12.3 Homework-Eliyah Atkins - Google Chrome X xlitemprod.pearsoncmg.com/api/v1/print/math Student: Eliyah Atkins Instructor: Stephen Trouard Date: 09/06/20 Course: DAT 473 A Fall 2020 Assignment: Section 12.3 Homework Print 4. A survey investigated how many pounds heavier respondents were than their perceived ideal weight. Consider the following data for the two-factor experiment as shown to the right. Complete parts a through c. Gender Region West Midwest South Northeast Men 15 13 17 18 19 16 16 Women 20 14 23 19 15 16 a. Determine if there is interaction between Region and Gender. Use the p-value approach and a significance level of 0.05. Find the hypotheses. Choose the correct answer below. O A. Ho: Region and Gender do not interact to affect the mean response HA: Region and Gender do interact to affect the mean response O B. Ho: Region and Gender do interact HA: Region and Gender do not interact to affect the mean response O C. Ho: Region and Gender do interact HA: Not all Region and Gender means are equal Find the test statistic. F= (Round to three decimal places as needed.) Find the p-value. p-value = Round to three decimal places as needed.) Choose the correct conclusion below. O A. Reject Ho. There is sufficient evidence that not all region and gender means are equal. O B. Do not reject Ho. There is sufficient evidence that region and gender do interact. O C. Reject Ho- There is insufficient evidence that region and gender do interact. O D. Do not reject Ho. There is insufficient evidence that region and gender do interact. b. Given your findings in part a, determine any significant differences among the discrepancy between the average existing and desired weights in the regions. Let the region be factor A and gender be factor B. Find the hypotheses. Choose the correct answer below. O A. Ho: HA1 = HA2 = HA3 = HA4 HA HA1 # HA2 # HA3 # HA4 O B. Ho: HA1 = HA2 = HA3 = HA4 HA: At least two regions have different averages in the discrepancy between existing and desired weight O C. Ho: At least two regions have different averages in the discrepancy between existing and desired weight HA HA1 = HA2 = HA3 = HA4 Find the test statistic. F = (Round to three decimal places as needed.) Find the p-value. p-value = (Round to three decimal places as needed.) Type here to search O 11:30 AM 9/6/2020Section 12.3 Homework-Eliyah Atkins - Google Chrome X xlitemprod.pearsoncmg.com/api/v1/print/math b. Given your findings in part a, determine any significant differences among the discrepancy between the average existing and desired weights in the regions. Print Let the region be factor A and gender be factor B. Find the hypotheses. Choose the correct answer below. O A. Ho: HA1 = HA2 = HA3 = HA4 HA HA1 # HA2 # HA3 # HA4 O B. Ho: HA1 = HA2 = HA3 = HA4 HA: At least two regions have different averages in the discrepancy between existing and desired weight O C. Ho: At least two regions have different averages in the discrepancy between existing and desired weight HA HA1 = HA2 = HA3 = HA4 Find the test statistic. F = Round to three decimal places as needed.) Find the p-value. p-value = (Round to three decimal places as needed.) Choose the correct conclusion below. O A. Do not reject Ho. There is insufficient evidence to indicate that at least two regions have different averages in the discrepancy between existing and desired weight. O B. Reject Ho. There is insufficient evidence to indicate that at least two regions have different averages in the discrepancy between existing and desired weight O C. Do not reject Ho. There is sufficient evidence that HA1 # HA2 # HA3 # HA4- O D. Reject Ho. There is sufficient evidence that HA1 # HA2 # HA3 # HA4 c. Repeat part b for the Gender factor. Find the hypotheses. Choose the correct answer below. O A. HO: HB1
Step by Step Solution
There are 3 Steps involved in it

Get step-by-step solutions from verified subject matter experts