

Question: I need help on h. 7:20 Done SPC Project Outline Spring 2... gampa has range) and discuss your findings based on the graphs. d- Construct
I need help on h. 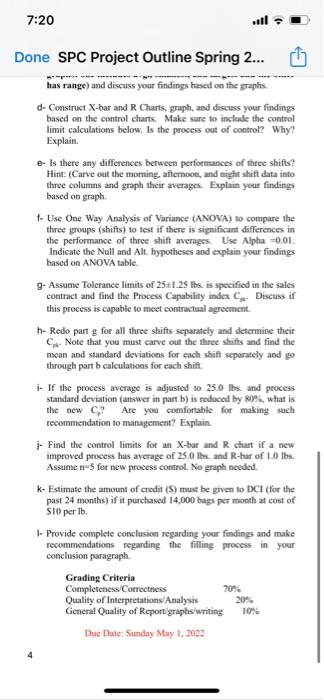
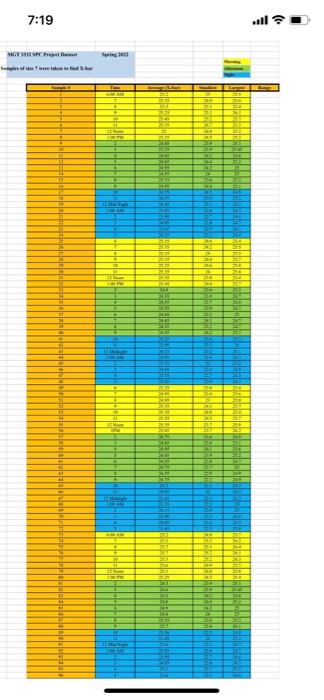
7:20 Done SPC Project Outline Spring 2... gampa has range) and discuss your findings based on the graphs. d- Construct X-bar and R Charts, graph, and discuss your findings based on the control charts. Make sure to include the control limit calculations below. Is the process out of control? Why? Explain. e- Is there any differences between performances of three shifts? Hint: (Carve out the morning, afternoon, and night shift data into three columns and graph their averages. Explain your findings based on graph. f- Use One Way Analysis of Variance (ANOVA) to compare the three groups (shifts) to test if there is significant differences in the performance of three shift averages. Use Alpha -0.01. Indicate the Null and Alt. hypotheses and explain your findings based on ANOVA table. g- Assume Tolerance limits of 25+1.25 lbs is specified in the sales contract and find the Process Capability index C- Discuss if this process is capable to meet contractual agreement. h- Redo part g for all three shifts separately and determine their Ca- Note that you must carve out the three shifts and find the mean and standard deviations for each shift separately and go through part b calculations for each shift. - If the process average is adjusted to 25.0 lbs. and process standard deviation (answer in part b) is reduced by 80%, what is the new C Are you comfortable for making such recommendation to management? Explain. j- Find the control limits for an X-bar and R chart if a new improved process has average of 25.0 lbs. and R-bar of 1.0 lbs. Assume n-5 for new process control. No graph needed. k- Estimate the amount of credit (S) must be given to DCI (for the past 24 months) if it purchased 14,000 bags per month at cost of $10 per lb. - Provide complete conclusion regarding your findings and make recommendations regarding the filling process in your conclusion paragraph. Grading Criteria Completeness Correctness 70% Quality of Interpretations/Analysis General Quality of Report/graphs writing Due Date: Sunday May 1, 2022 20% 10% 7:19 NIGT BOSCH Smood GE * LL 2 SE UR FL 50 7 51 15 13 TE F 5 7:20 Done SPC Project Outline Spring 2... gampa has range) and discuss your findings based on the graphs. d- Construct X-bar and R Charts, graph, and discuss your findings based on the control charts. Make sure to include the control limit calculations below. Is the process out of control? Why? Explain. e- Is there any differences between performances of three shifts? Hint: (Carve out the morning, afternoon, and night shift data into three columns and graph their averages. Explain your findings based on graph. f- Use One Way Analysis of Variance (ANOVA) to compare the three groups (shifts) to test if there is significant differences in the performance of three shift averages. Use Alpha -0.01. Indicate the Null and Alt. hypotheses and explain your findings based on ANOVA table. g- Assume Tolerance limits of 25+1.25 lbs is specified in the sales contract and find the Process Capability index C- Discuss if this process is capable to meet contractual agreement. h- Redo part g for all three shifts separately and determine their Ca- Note that you must carve out the three shifts and find the mean and standard deviations for each shift separately and go through part b calculations for each shift. - If the process average is adjusted to 25.0 lbs. and process standard deviation (answer in part b) is reduced by 80%, what is the new C Are you comfortable for making such recommendation to management? Explain. j- Find the control limits for an X-bar and R chart if a new improved process has average of 25.0 lbs. and R-bar of 1.0 lbs. Assume n-5 for new process control. No graph needed. k- Estimate the amount of credit (S) must be given to DCI (for the past 24 months) if it purchased 14,000 bags per month at cost of $10 per lb. - Provide complete conclusion regarding your findings and make recommendations regarding the filling process in your conclusion paragraph. Grading Criteria Completeness Correctness 70% Quality of Interpretations/Analysis General Quality of Report/graphs writing Due Date: Sunday May 1, 2022 20% 10% 7:19 NIGT BOSCH Smood GE * LL 2 SE UR FL 50 7 51 15 13 TE F 5
Step by Step Solution
There are 3 Steps involved in it
1 Expert Approved Answer
Step: 1 Unlock

Question Has Been Solved by an Expert!
Get step-by-step solutions from verified subject matter experts
Step: 2 Unlock
Step: 3 Unlock