

Question: I need help on how to approach a problem I have. I want to analyze two sets of data, COVID-19 Cases in the United States
I need help on how to approach a problem I have. I want to analyze two sets of data, COVID-19 Cases in the United States vs ASM in the United States during the period January to June 2020. I thought a two sample t-test would be good then follow the 5 step hypothesis test. Any suggestion if I'm on the correct path and how to accomplish this would be appreciated.
Hypotheses:
H(0): There is no relationship between COVID 19 cases and Available Seat Mile (ASM) capacity reduction during the period from January to June of 2020 in the United States.
H(a): There is a relationship between COVID 19 cases and Available Seat Mile (ASM) capacity reduction during the period from January to June of 2020 in the United States.
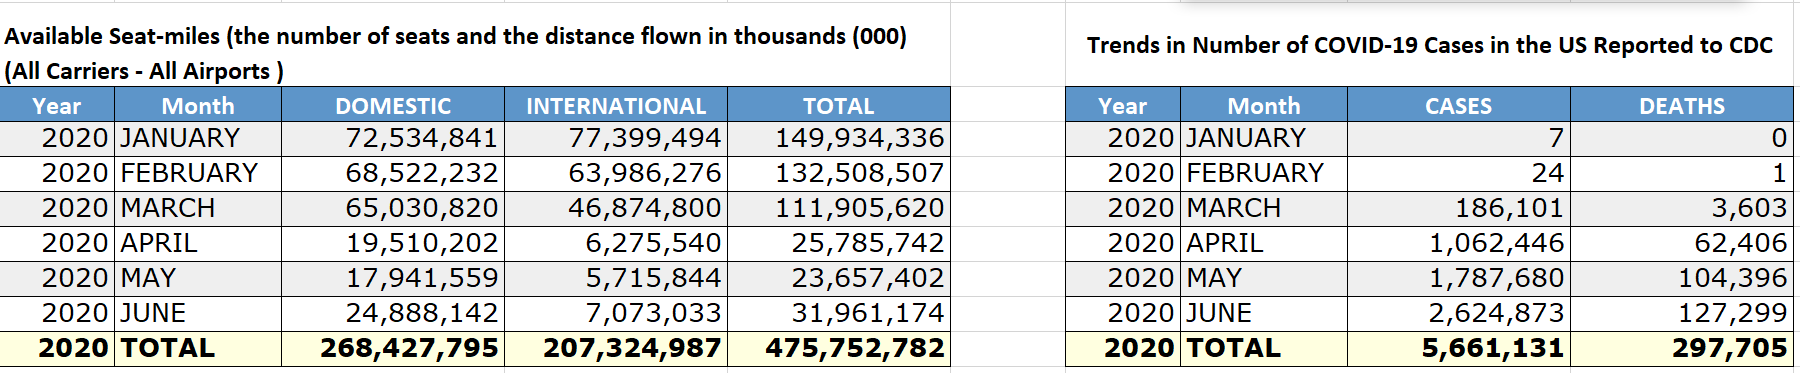
Available Seat-miles (the number of seats and the distance flown in thousands (000) (All Carriers - All Airports ) Trends in Number of COVID-19 Cases in the US Reported to CDC Year Month DOMESTIC INTERNATIONAL TOTAL Year Month CASES DEATHS 2020 JANUARY 72,534,841 77,399,494 149,934,336 2020 JANUARY 7 0 2020 FEBRUARY 68,522,232 63,986,276 132,508,507 2020 FEBRUARY 24 1 2020 MARCH 65,030,820 46,874,800 111,905,620 2020 MARCH 186,101 3,603 2020 APRIL 19,510,202 6,275,540 25,785,742 2020 APRIL 1,062,446 62,406 2020 MAY 17,941,559 5,715,844 23,657,402 2020 MAY 1,787,680 104,396 2020 JUNE 24,888,142 7,073,033 31,961,174 2020 JUNE 2,624,873 127,299 2020 TOTAL 268,427,795 207,324,987 475,752,782 2020 TOTAL 5,661,131 297,705
Step by Step Solution
There are 3 Steps involved in it

Get step-by-step solutions from verified subject matter experts