

Question: I need help on making the graphs for these answers since my professor doesn't know how to and just explain things in sentences. All I
I need help on making the graphs for these answers since my professor doesn't know how to and just explain things in sentences. All I need are the graphs based on the answers that was given.
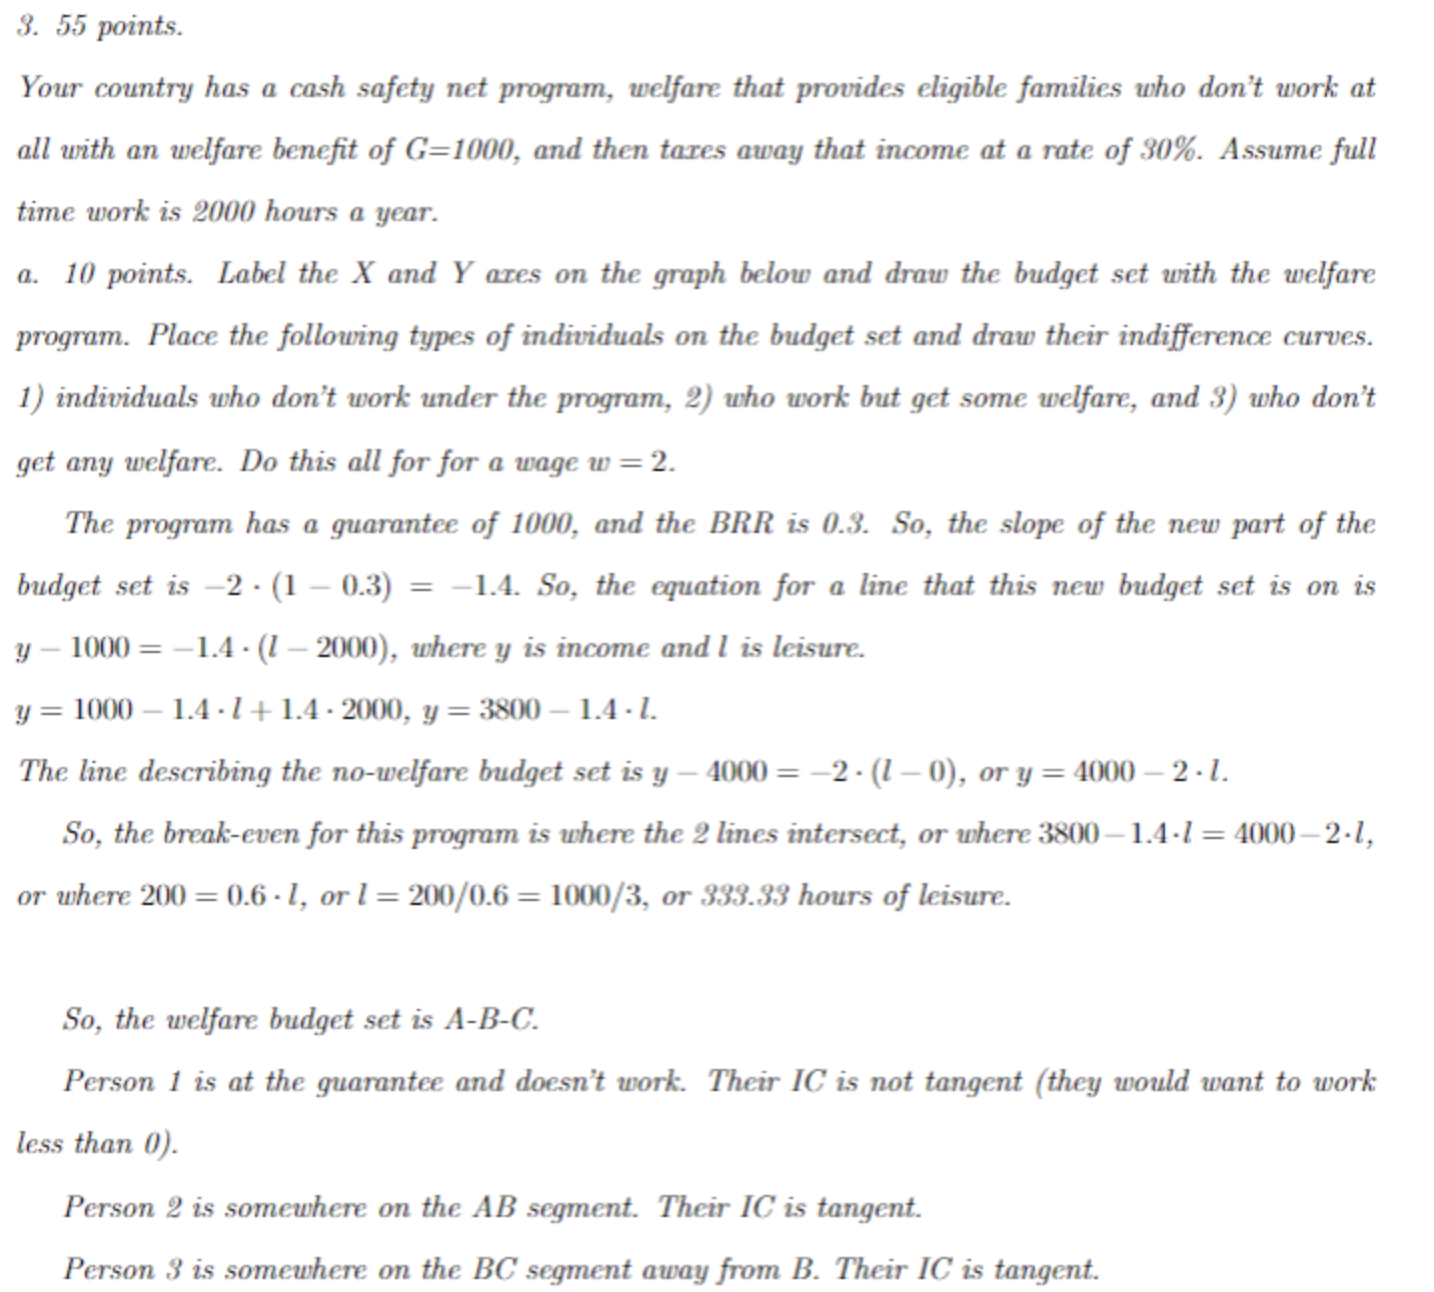
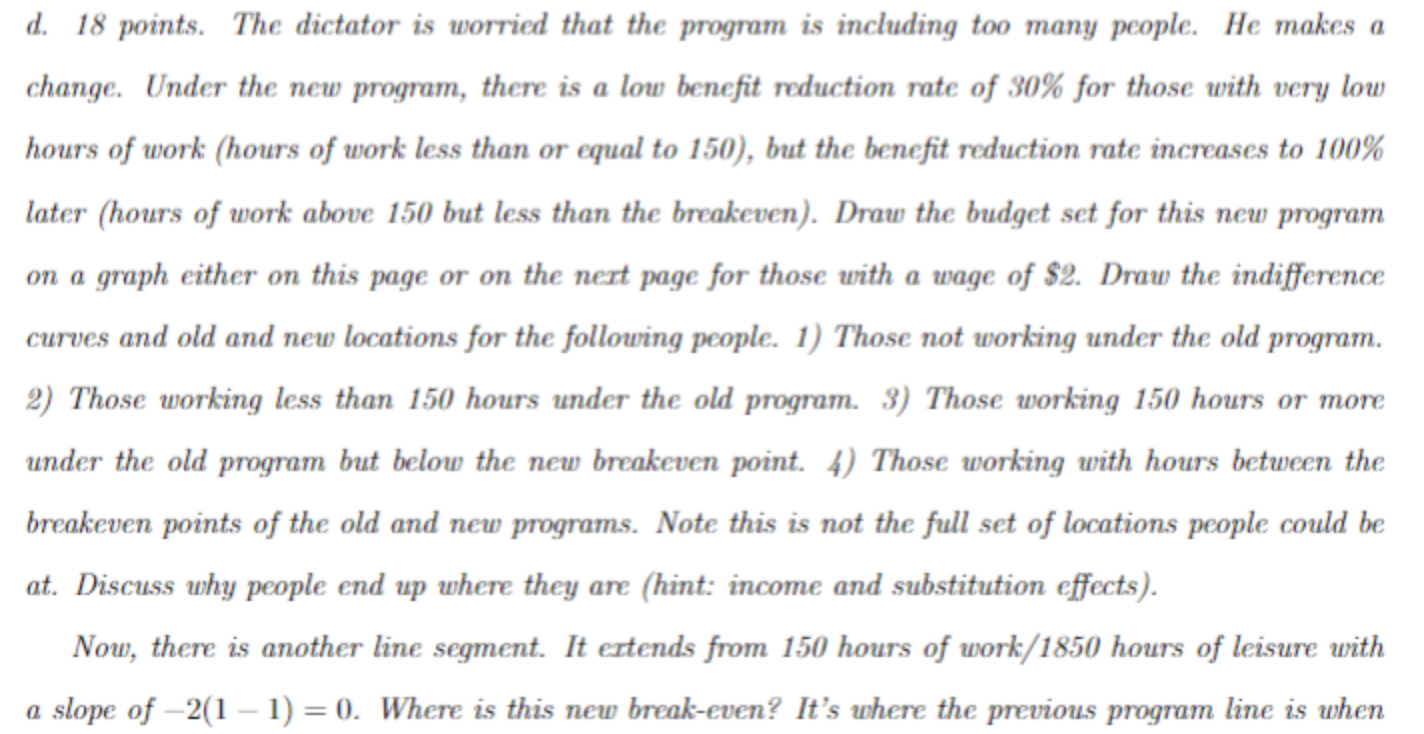
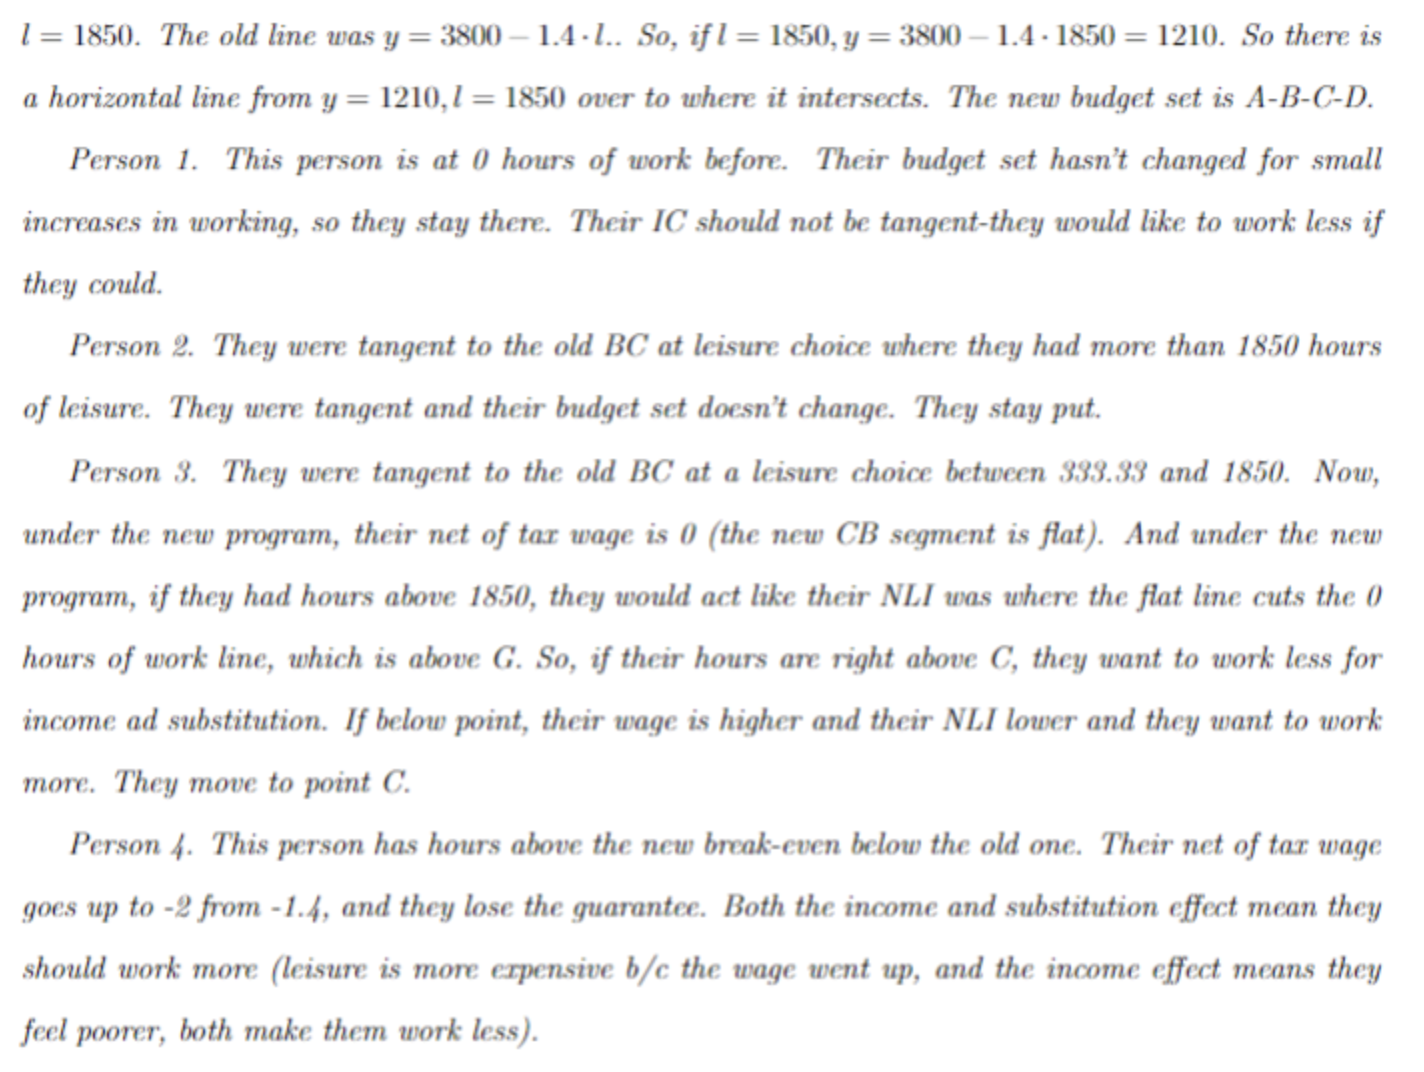
3. 55 points. Your country has a cash safety net program, welfare that provides eligible families who don't work at all with an welfare benefit of G=1000, and then tares away that income at a rate of 30%. Assume full time work is 2000 hours a year. a. 10 points. Label the X and Y ares on the graph below and draw the budget set wnth the welfare program. Place the following types of indimduals on the budget set and draw their indifference curves. 1) individuals who don't work under the program, 2) who work but get some welfare, and 3) who don't get any welfare. Do this all for for a wage w = 2. The program has a quarantee of 1000, and the BRR 1s 0.3. So, the slope of the new part of the budget set is 2 - (1 0.3) = 1.4. So, the equation for a line that this new budget set is on is y 1000 = 1.4- (I 2000), where y is income and | is leisure. y=1000 1.4-1+ 1.4-2000, y = 3800 1.4-1. The line describing the no-welfare budget set is y 4000 = -2- (I 0), or y = 4000 2- L. So, the break-even for this program is where the 2 lines intersect, or where 3800 1.4-1 = 4000 2-1, or where 200 = 0.6 - 1, or [ = 200/0.6 = 1000/3, or 333.33 hours of leisure. So, the welfare budget set is A-B-C. Person 1 is at the quarantee and doesn't work. Their IC is not tangent (they would want to work less than 0). Person 2 is somewhere on the AB segment. Their IC is tangent. Person 3 is somewhere on the BC segment away from B. Their IC is tangent. d. 18 points. The dictator is worried that the program is including too many people. He makes a change. Under the new program, there is a low benefit reduction rate of 30% for those with very low hours of work (hours of work less than or equal to 150), but the benefit reduction rate increases to 100% later (hours of work above 150 but less than the breakeven). Draw the budget set for this new program on a graph either on this page or on the next page for those with a wage of $2. Draw the indifference curves and old and new locations for the follounng people. 1) Those not working under the old program. 2) Those working less than 150 hours under the old program. 3) Those working 150 hours or more under the old program but below the new breakeven point. ) Those working with hours between the breakeven points of the old and new programs. Note this is not the full set of locations people could be at. Discuss why people end up where they are (hint: income and substitution effects). Now, there is another line segment. It extends from 150 hours of work/1850 hours of leisure with a slope of ~2(1 1) = 0. Where is this new break-even? It's where the previous program line is when [ = 1850. The old line was y = 3800 1.4-1.. So, if [ = 1850, y = 3800 1.4 - 1850 = 1210. So there is a horizontal line from y = 1210,1 = 1850 over to where it intersects. The new budget set is A-B-C-D. Person 1. This person is at () hours of work before. Their budget set hasn't changed for small increases in working, so they stay there. Their IC should not be tangent-they would like to work less if they could. Person 2. They were tangent to the old BC at leisure choice where they had more than 1850 hours of leisure. They were tangent and their budget set doesn't change. They stay put. Person 3. They were tangent to the old BC at a leisure choice between 333.3% and 1850. Now, under the new program, their net of tax wage is 0 (the new CB segment is flat). And under the new program, if they had hours above 1850, they would act like their NLI was where the flat line cuts the hours of work line, which is above (. So, if their hours are right above C, they want to work less for income ad substitution. If below point, their wage is higher and their NLI lower and they want to work more. They move to point C. Person 4. This person has hours above the new break-cven below the old one. Their net of tax wage goes up to -2 from -1.4, and they lose the guarantec. Both the income and substitution effect mean they should work more (leisure is more expensive b/c the wage went up, and the income effect means they feel poorer, both make them work less)
Step by Step Solution
There are 3 Steps involved in it

Get step-by-step solutions from verified subject matter experts