

Question: ***** I NEED HELP ON PART 4- LEAN OPERATION SECTION A, B, C, AND D****** PLEASE AND THANK YOU RA R6 Hypothetically, we are analyzing
***** I NEED HELP ON PART 4- LEAN OPERATION SECTION A, B, C, AND D****** PLEASE AND THANK YOU
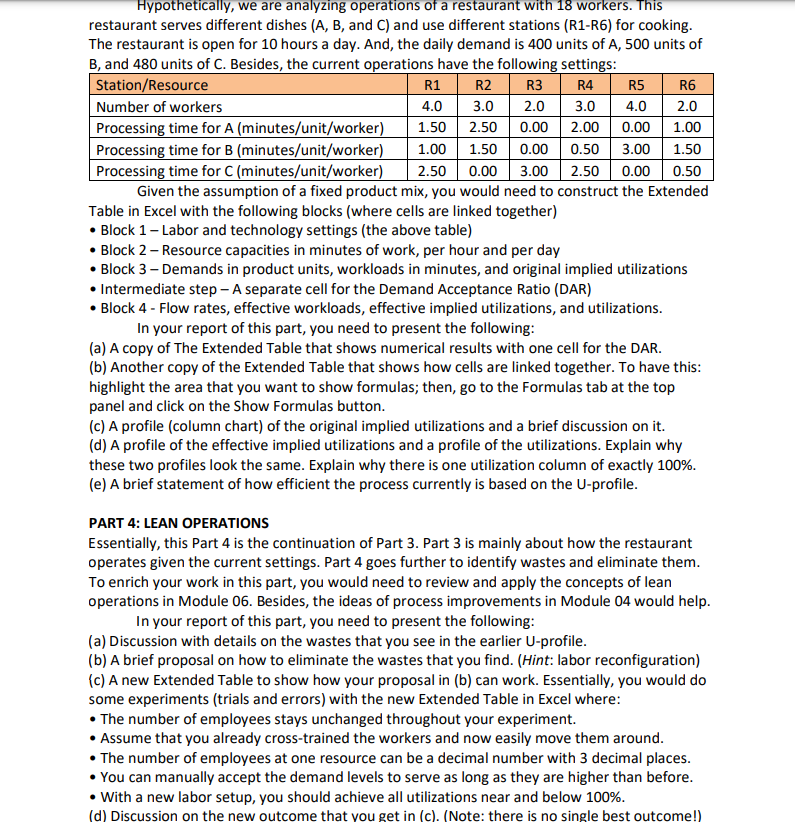
RA R6 Hypothetically, we are analyzing operations of a restaurant with 18 workers. This restaurant serves different dishes (A, B, and C) and use different stations (R1-R6) for cooking. The restaurant is open for 10 hours a day. And, the daily demand is 400 units of A, 500 units of B, and 480 units of C. Besides, the current operations have the following settings: Station/Resource R1 R2 R3 R5 Number of workers 4.0 3.0 2.0 3.0 4.0 2.0 Processing time for A (minutes/unit/worker) 1.50 2.50 0.00 2.00 0.00 1.00 Processing time for B (minutes/unit/worker) 1.00 1.500.00 0.50 3.00 1.50 Processing time for C(minutes/unit/worker) 2.500.00 3.00 2.50 0.00 0.50 Given the assumption of a fixed product mix, you would need to construct the Extended Table in Excel with the following blocks (where cells are linked together) Block 1 - Labor and technology settings (the above table) Block 2 - Resource capacities in minutes of work, per hour and per day Block 3 - Demands in product units, workloads in minutes, and original implied utilizations Intermediate step - A separate cell for the Demand Acceptance Ratio (DAR) Block 4 - Flow rates, effective workloads, effective implied utilizations, and utilizations. In your report of this part, you need to present the following: (a) A copy of The Extended Table that shows numerical results with one cell for the DAR. (b) Another copy of the Extended Table that shows how cells are linked together. To have this: highlight the area that you want to show formulas; then, go to the Formulas tab at the top panel and click on the Show Formulas button. (c) A profile (column chart) of the original implied utilizations and a brief discussion on it. (d) A profile of the effective implied utilizations and a profile of the utilizations. Explain why these two profiles look the same. Explain why there is one utilization column of exactly 100%. (e) A brief statement of how efficient the process currently is based on the U-profile. PART 4: LEAN OPERATIONS Essentially, this Part 4 is the continuation of Part 3. Part 3 is mainly about how the restaurant operates given the current settings. Part 4 goes further to identify wastes and eliminate them. To enrich your work in this part, you would need to review and apply the concepts of lean operations in Module 06. Besides, the ideas of process improvements in Module 04 would help. In your report of this part, you need to present the following: (a) Discussion with details on the wastes that you see in the earlier U-profile. (b) A brief proposal on how to eliminate the wastes that you find. (Hint: labor reconfiguration) (c) A new Extended Table to show how your proposal in (b) can work. Essentially, you would do some experiments (trials and errors) with the new Extended Table in Excel where: The number of employees stays unchanged throughout your experiment. Assume that you already cross-trained the workers and now easily move them around. The number of employees at one resource can be a decimal number with 3 decimal places. You can manually accept the demand levels to serve as long as they are higher than before. . With a new labor setup, you should achieve all utilizations near and below 100%. (d) Discussion on the new outcome that you get in (c). (Note: there is no single best outcome!)Step by Step Solution
There are 3 Steps involved in it
1 Expert Approved Answer
Step: 1 Unlock

Question Has Been Solved by an Expert!
Get step-by-step solutions from verified subject matter experts
Step: 2 Unlock
Step: 3 Unlock