

Question: I need help on the production function graph and the total cost graph. Study Tools Fill in the blanks to complete the Marginal Product column
I need help on the production function graph and the total cost graph.
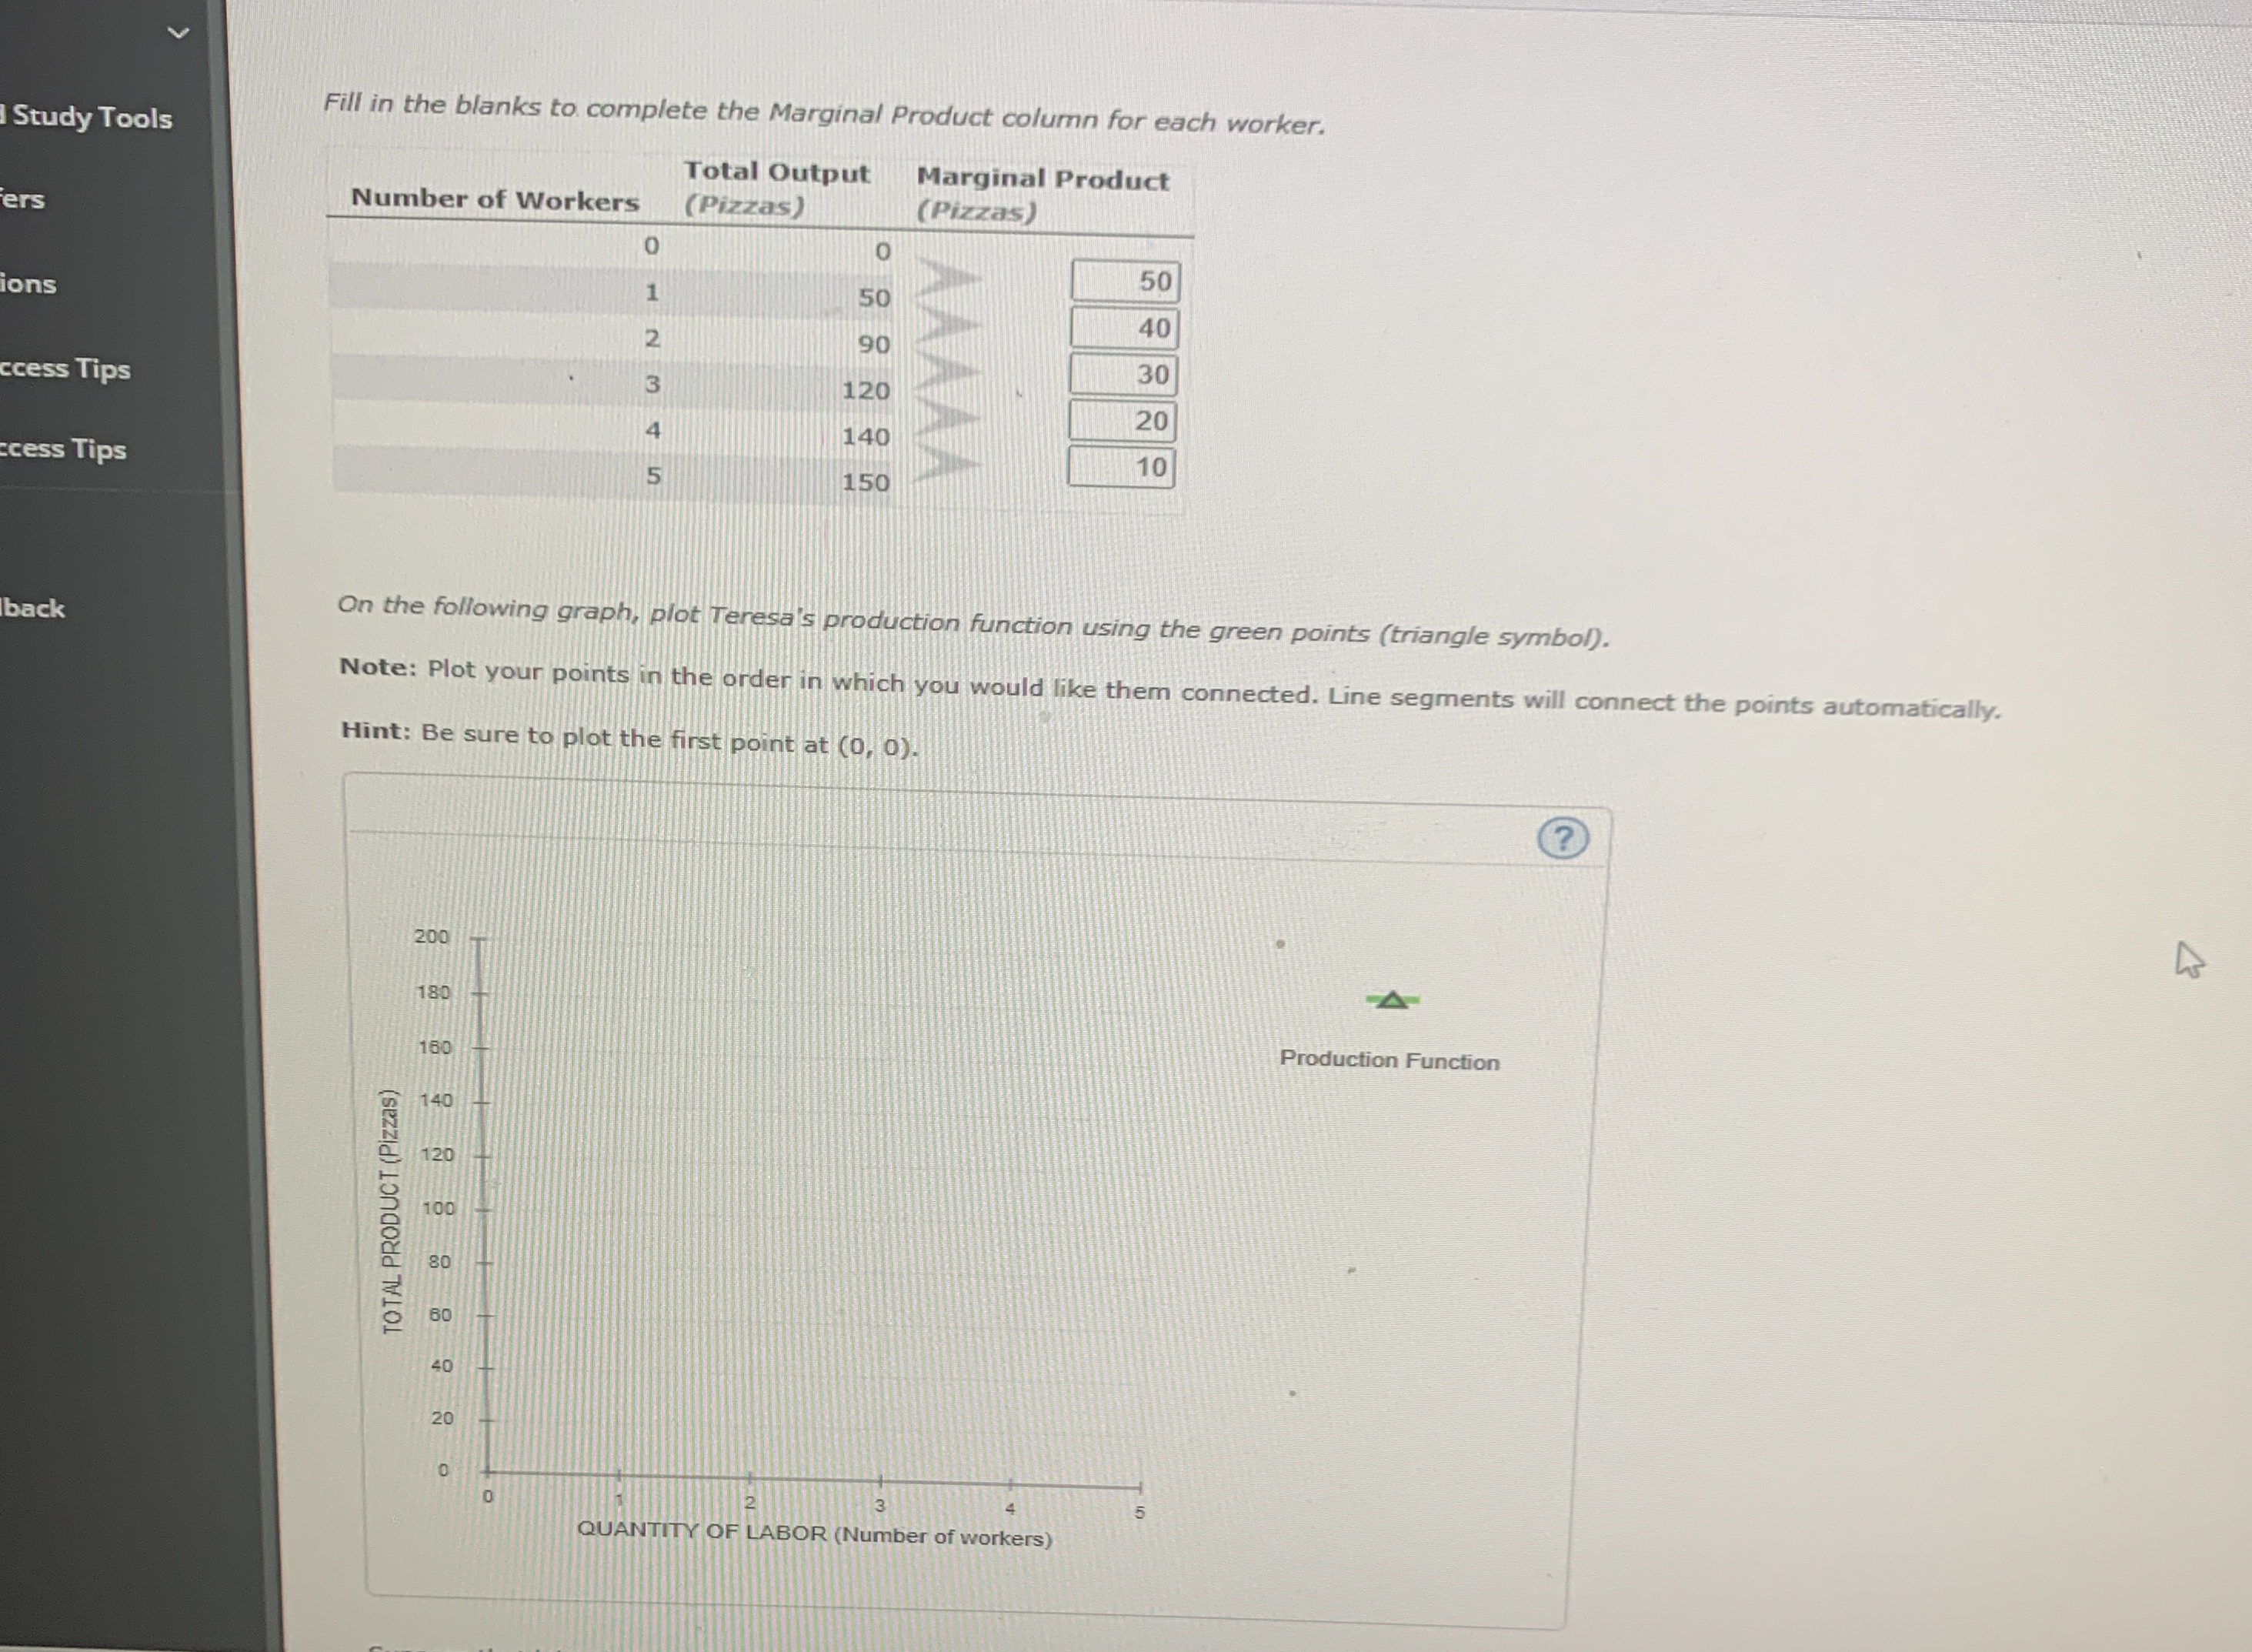
Study Tools Fill in the blanks to complete the Marginal Product column for each worker. Total Output Marginal Product ers Number of Workers (Pizzas) (Pizzas) LO 50 ions 50 40 90 ccess Tips 30 120 U A 20 140 cess Tips 10 150 back On the following graph, plot Teresa's production function using the green points (triangle symbol). Note: Plot your points in the order in which you would like them connected. Line segments will connect the points automatically. Hint: Be sure to plot the first point at (0, 0). (? 200 180 160 Production Function TOTAL PRODUCT (Pizzas) 140 120 100 80 40 20 3 QUANTITY OF LABOR (Number of workers)
Step by Step Solution
There are 3 Steps involved in it

Get step-by-step solutions from verified subject matter experts