

Question: I need help on these questions. Please provide full explanation and provide steps! The production of the Reliable Manufacturing Company for 2013 and part of
I need help on these questions. Please provide full explanation and provide steps!
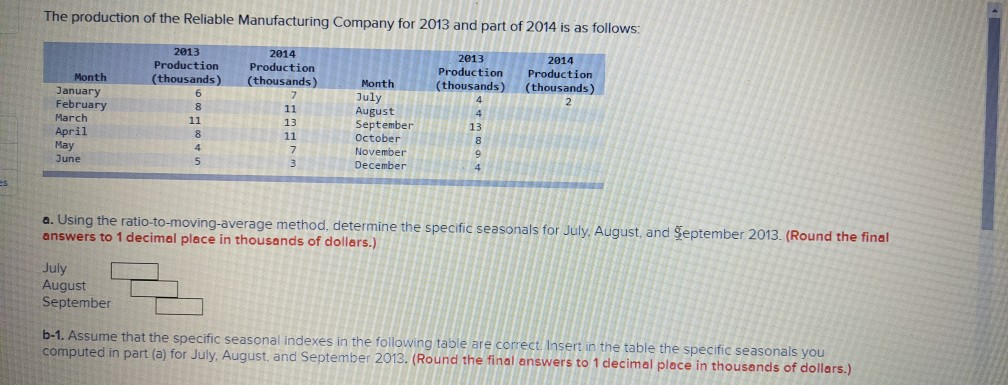
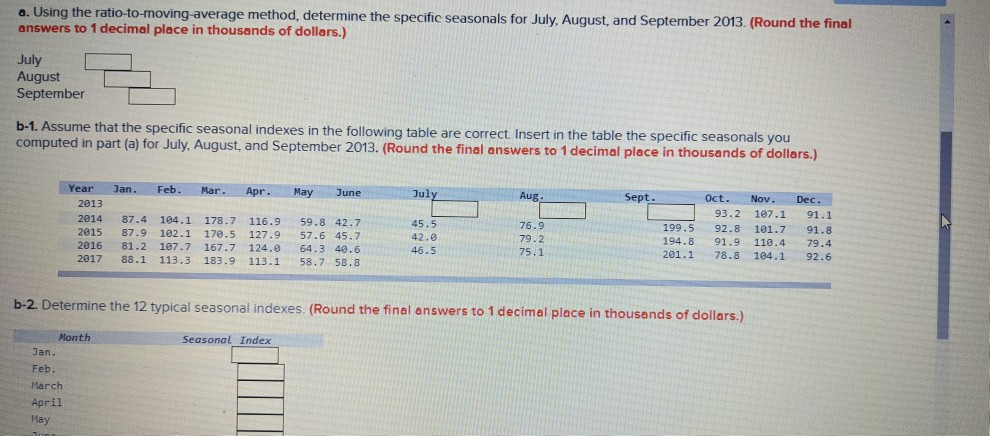
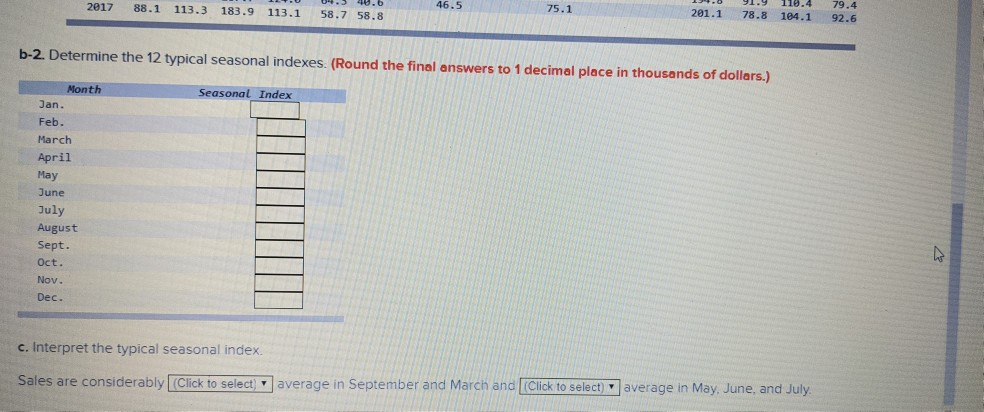
The production of the Reliable Manufacturing Company for 2013 and part of 2014 is as follows: 2013 Production (thousands) 2014 Production (thousands) 2013 Production (thousands) 2014 Production (thousands) 00 Month January February March April May June Month July August September October November December 00 U a. Using the ratio-to-moving average method, determine the specific seasonals for July, August, and September 2013. (Round the final answers to 1 decimal place in thousands of dollars.) July August September b-1. Assume that the specific seasonal indexes in the following table are correct. Insert in the table the specific seasonals you computed in part (a) for July, August, and September 2013. (Round the final answers to 1 decimal place in thousands of dollars.) a. Using the ratio-to-moving average method, determine the specific seasonals for July, August, and September 2013. (Round the final answers to 1 decimal place in thousands of dollars.) July August September b-1. Assume that the specific seasonal indexes in the following table are correct. Insert in the table the specific seasonals you computed in part (a) for July, August, and September 2013. (Round the final answers to 1 decimal place in thousands of dollars.) Jan. Feb. May June July Aug. Sept. 45.5 Year 2013 2014 2015 2016 2017 87.4 87.9 81.2 88.1 104.1 102.1 107.7 113.3 178.7 176.5 167.7 183.9 116. 9 127.9 124. 113.1 59.8 42.7 57.6 45.7 64.3 40.6 58.7 58.8 76.9 79.2 75.1 199.5 194.8 201.1 Oct. 93.2 92.8 91.9 78.8 Nov. 107.1 101.7 110.4 104.1 Dec. 91.1 91.8 79.4 92.6 45.5 b-2. Determine the 12 typical seasonal indexes (Round the final answers to 1 decimal place in thousands of dollars.) Seasonal Index Month Jan. Feb. March April May 46.5 75.1 201.1 78.8 104.1 92.6 2017 88.1 113.3 183.9 113.1 58.7 58.8 b-2. Determine the 12 typical seasonal indexes. (Round the final answers to 1 decimal place in thousands of dollars.) Seasonal Index Month Jan. Feb. March April May June July August Sept. Oct. Nov. Dec. c. Interpret the typical seasonal index Sales are considerably (Click to select average in September and March and [Click to select) average in May, June, and July The production of the Reliable Manufacturing Company for 2013 and part of 2014 is as follows: 2013 Production (thousands) 2014 Production (thousands) 2013 Production (thousands) 2014 Production (thousands) 00 Month January February March April May June Month July August September October November December 00 U a. Using the ratio-to-moving average method, determine the specific seasonals for July, August, and September 2013. (Round the final answers to 1 decimal place in thousands of dollars.) July August September b-1. Assume that the specific seasonal indexes in the following table are correct. Insert in the table the specific seasonals you computed in part (a) for July, August, and September 2013. (Round the final answers to 1 decimal place in thousands of dollars.) a. Using the ratio-to-moving average method, determine the specific seasonals for July, August, and September 2013. (Round the final answers to 1 decimal place in thousands of dollars.) July August September b-1. Assume that the specific seasonal indexes in the following table are correct. Insert in the table the specific seasonals you computed in part (a) for July, August, and September 2013. (Round the final answers to 1 decimal place in thousands of dollars.) Jan. Feb. May June July Aug. Sept. 45.5 Year 2013 2014 2015 2016 2017 87.4 87.9 81.2 88.1 104.1 102.1 107.7 113.3 178.7 176.5 167.7 183.9 116. 9 127.9 124. 113.1 59.8 42.7 57.6 45.7 64.3 40.6 58.7 58.8 76.9 79.2 75.1 199.5 194.8 201.1 Oct. 93.2 92.8 91.9 78.8 Nov. 107.1 101.7 110.4 104.1 Dec. 91.1 91.8 79.4 92.6 45.5 b-2. Determine the 12 typical seasonal indexes (Round the final answers to 1 decimal place in thousands of dollars.) Seasonal Index Month Jan. Feb. March April May 46.5 75.1 201.1 78.8 104.1 92.6 2017 88.1 113.3 183.9 113.1 58.7 58.8 b-2. Determine the 12 typical seasonal indexes. (Round the final answers to 1 decimal place in thousands of dollars.) Seasonal Index Month Jan. Feb. March April May June July August Sept. Oct. Nov. Dec. c. Interpret the typical seasonal index Sales are considerably (Click to select average in September and March and [Click to select) average in May, June, and July
Step by Step Solution
There are 3 Steps involved in it
1 Expert Approved Answer
Step: 1 Unlock

Question Has Been Solved by an Expert!
Get step-by-step solutions from verified subject matter experts
Step: 2 Unlock
Step: 3 Unlock