

Question: I need help on this! 1. Take your data home and use EXCEL to prepare a Beer's Law plot of the data from your standards
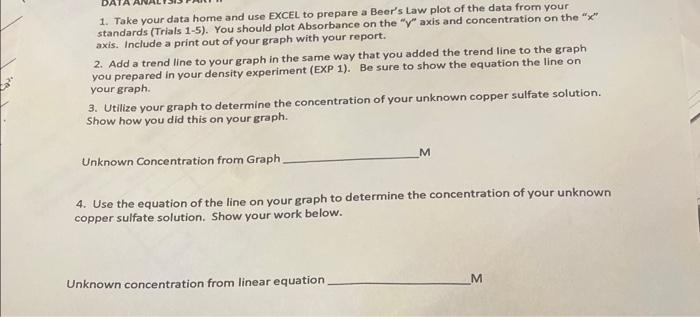
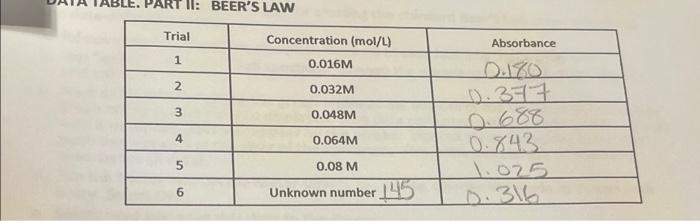
1. Take your data home and use EXCEL to prepare a Beer's Law plot of the data from your standards (Trials 1-5). You should plot Absorbance on the "V" axis and concentration on the "x" axis. Include a print out of your graph with your report. 2. Add a trend line to your graph in the same way that you added the trend line to the graph you prepared in your density experiment (EXP 1). Be sure to show the equation the line on your graph. 3. Utilize your graph to determine the concentration of your unknown copper sulfate solution. Show how you did this on your graph. M Unknown Concentration from Graph 4. Use the equation of the line on your graph to determine the concentration of your unknown copper sulfate solution. Show your work below. Unknown concentration from linear equation M PART II: BEER'S LAW Trial Absorbance Concentration (mol/L) 0.016M 1 2 0.032M 10.377 3 0.048M 4 0.064M 5 0.08 M 0.843 1.025 0.316 6 Unknown number 145
Step by Step Solution
There are 3 Steps involved in it

Get step-by-step solutions from verified subject matter experts