

Question: I need help. Part 2. Interpretation In an effort to understand how successful the promotion was, Pelican Stores management has produced the following statistics about
I need help.
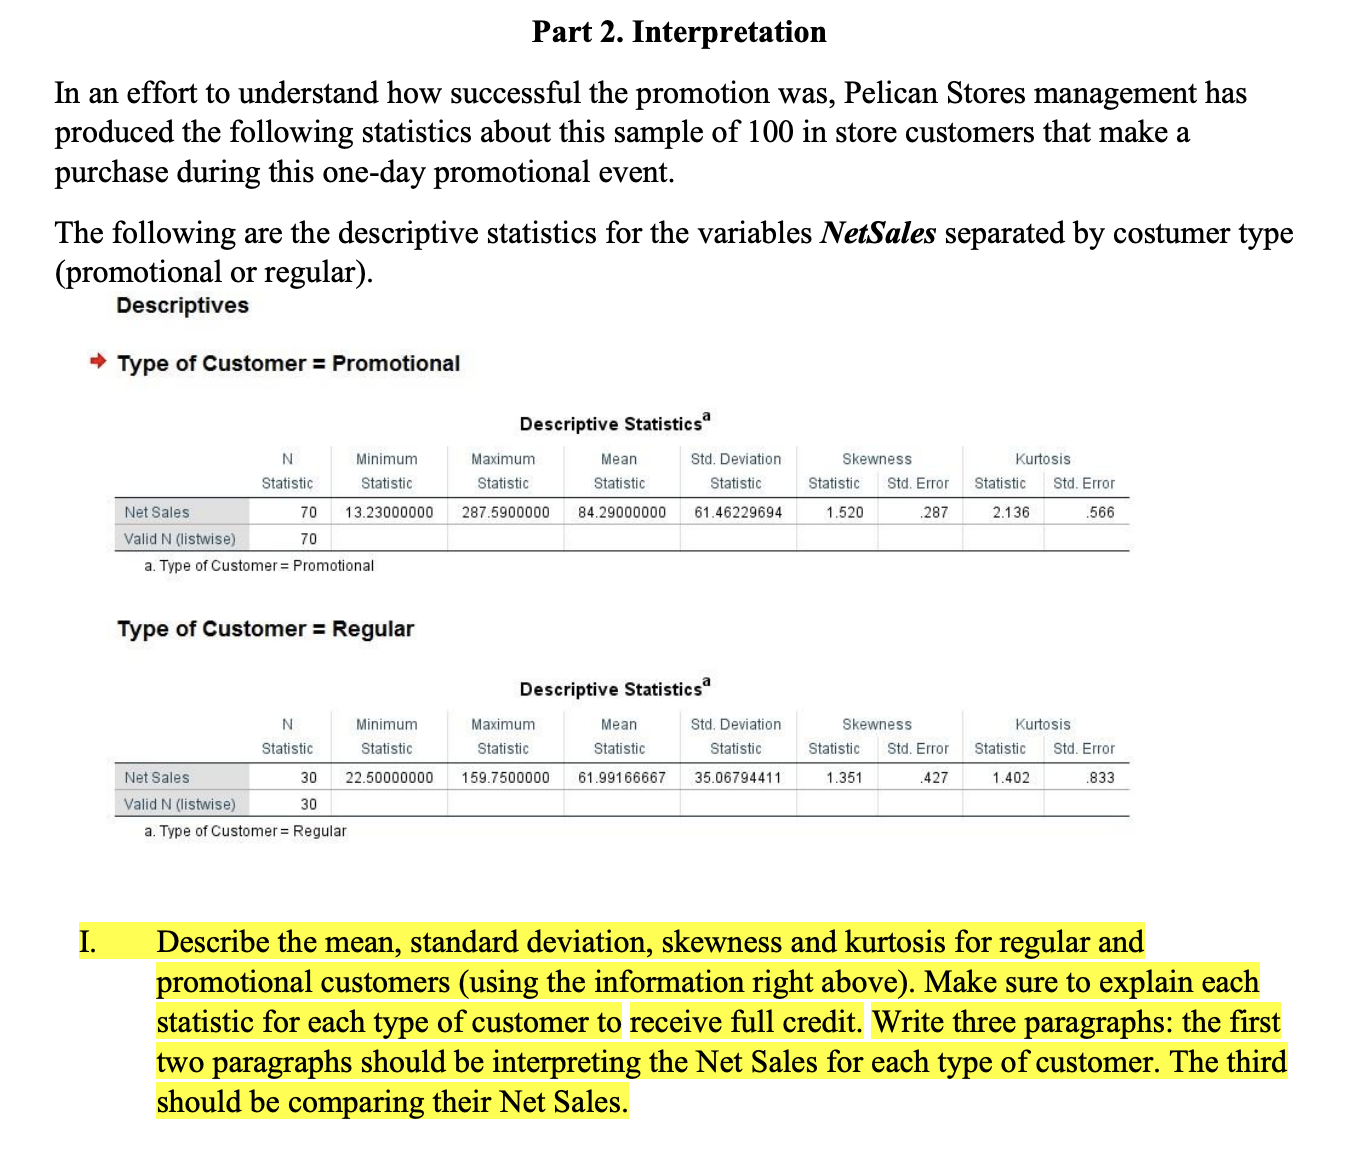
Part 2. Interpretation In an effort to understand how successful the promotion was, Pelican Stores management has produced the following statistics about this sample of 100 in store customers that make a purchase during this one-day promotional event. The following are the descriptive statistics for the variables NetSales separated by costumer type (promotional or regular). Descriptives * Type of Customer = Promotional Descriptive Statistics N Minimum Maximum Mean Std. Deviation Skewness Kurtosis Statistic Statistic Statistic Statistic Statistic Statistic Std. Error Statistic Std. Error Net Sales 70 13.23000000 287.5900000 84.29000000 61.46229694 1.520 287 2.136 566 Valid N (listwise) 70 a. Type of Customer = Promotional Type of Customer = Regular Descriptive Statistics N Minimum Maximum Mean Std. Deviation Skewness Kurtosis Statistic Statistic Statistic Statistic Statistic Statistic Std. Error Statistic Std. Error Net Sales 30 22.50000000 159.7500000 61.99166667 35.06794411 1.351 427 1.402 833 Valid N (listwise) 30 a. Type of Customer = Regular I. Describe the mean, standard deviation, skewness and kurtosis for regular and promotional customers (using the information right above). Make sure to explain each statistic for each type of customer to receive full credit. Write three paragraphs: the first two paragraphs should be interpreting the Net Sales for each type of customer. The third should be comparing their Net Sales
Step by Step Solution
There are 3 Steps involved in it

Get step-by-step solutions from verified subject matter experts