Question: I need help plot the points to this equation I have the pictures to explain what is going on. -> C webassign.net/web/Student/Assignment-Responses/tutorial?dep=26322425&tags=autosave#ques Need Help? 8.
I need help plot the points to this equation I have the pictures to explain what is going on.
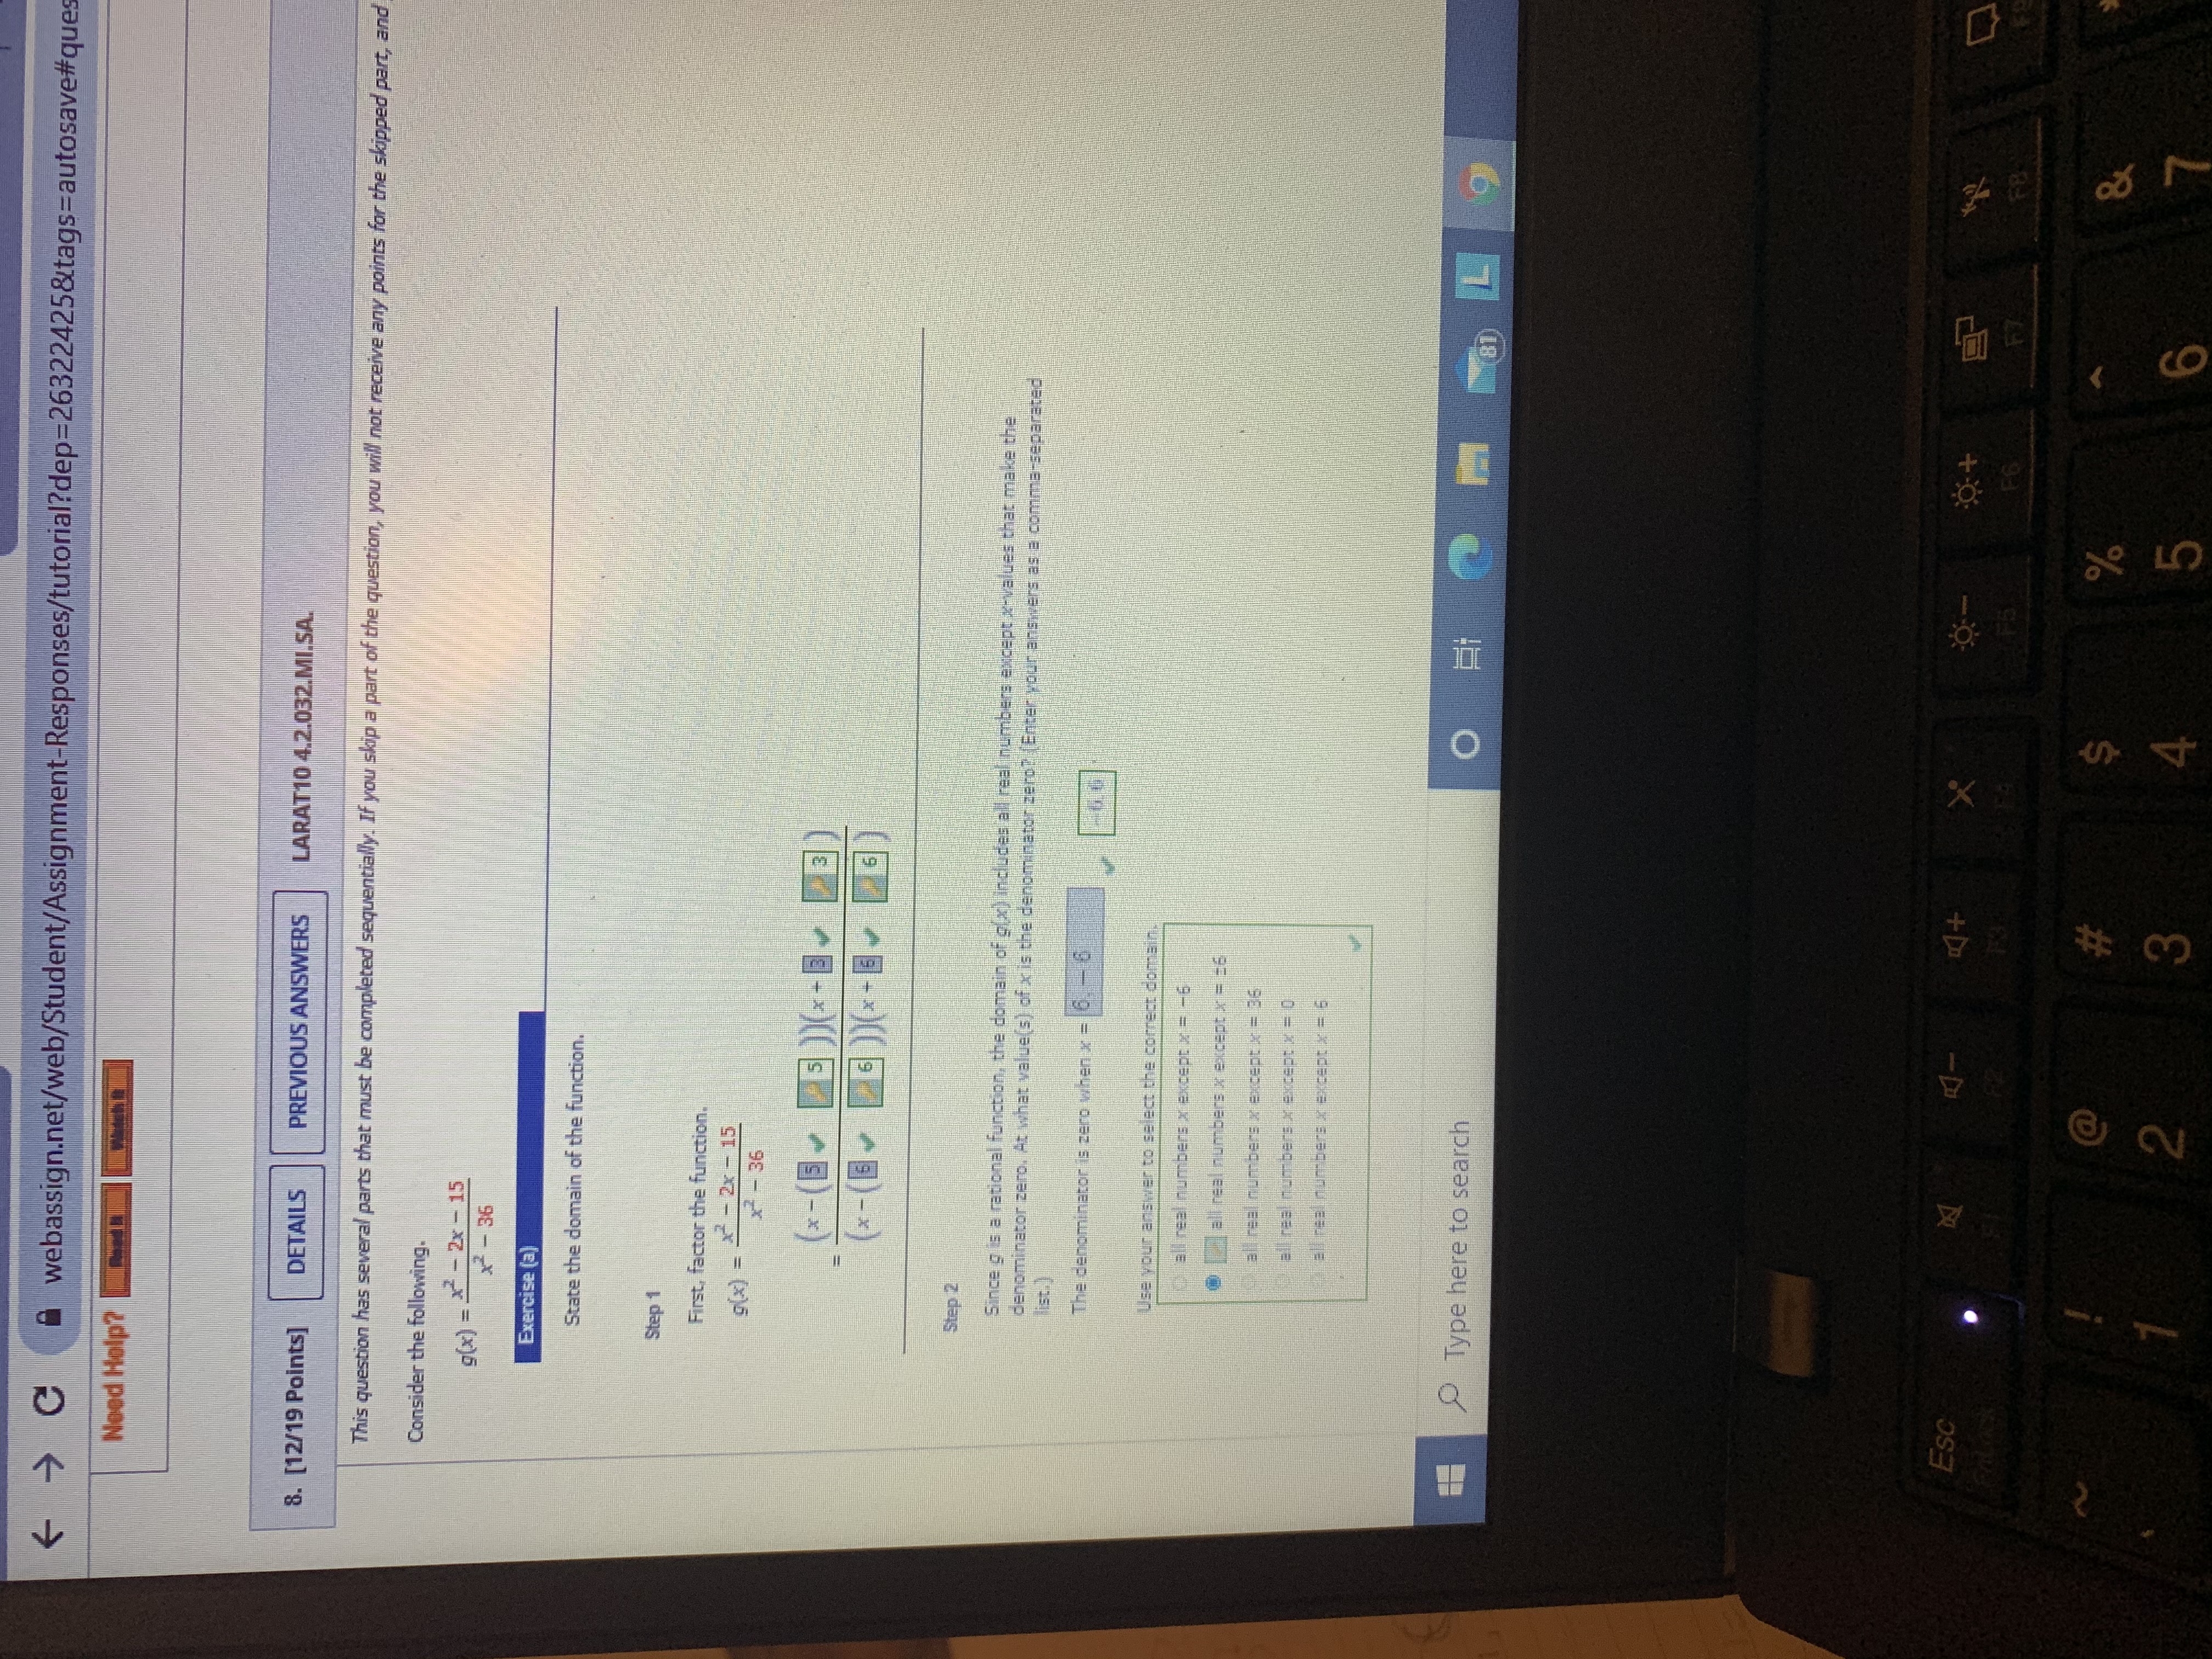
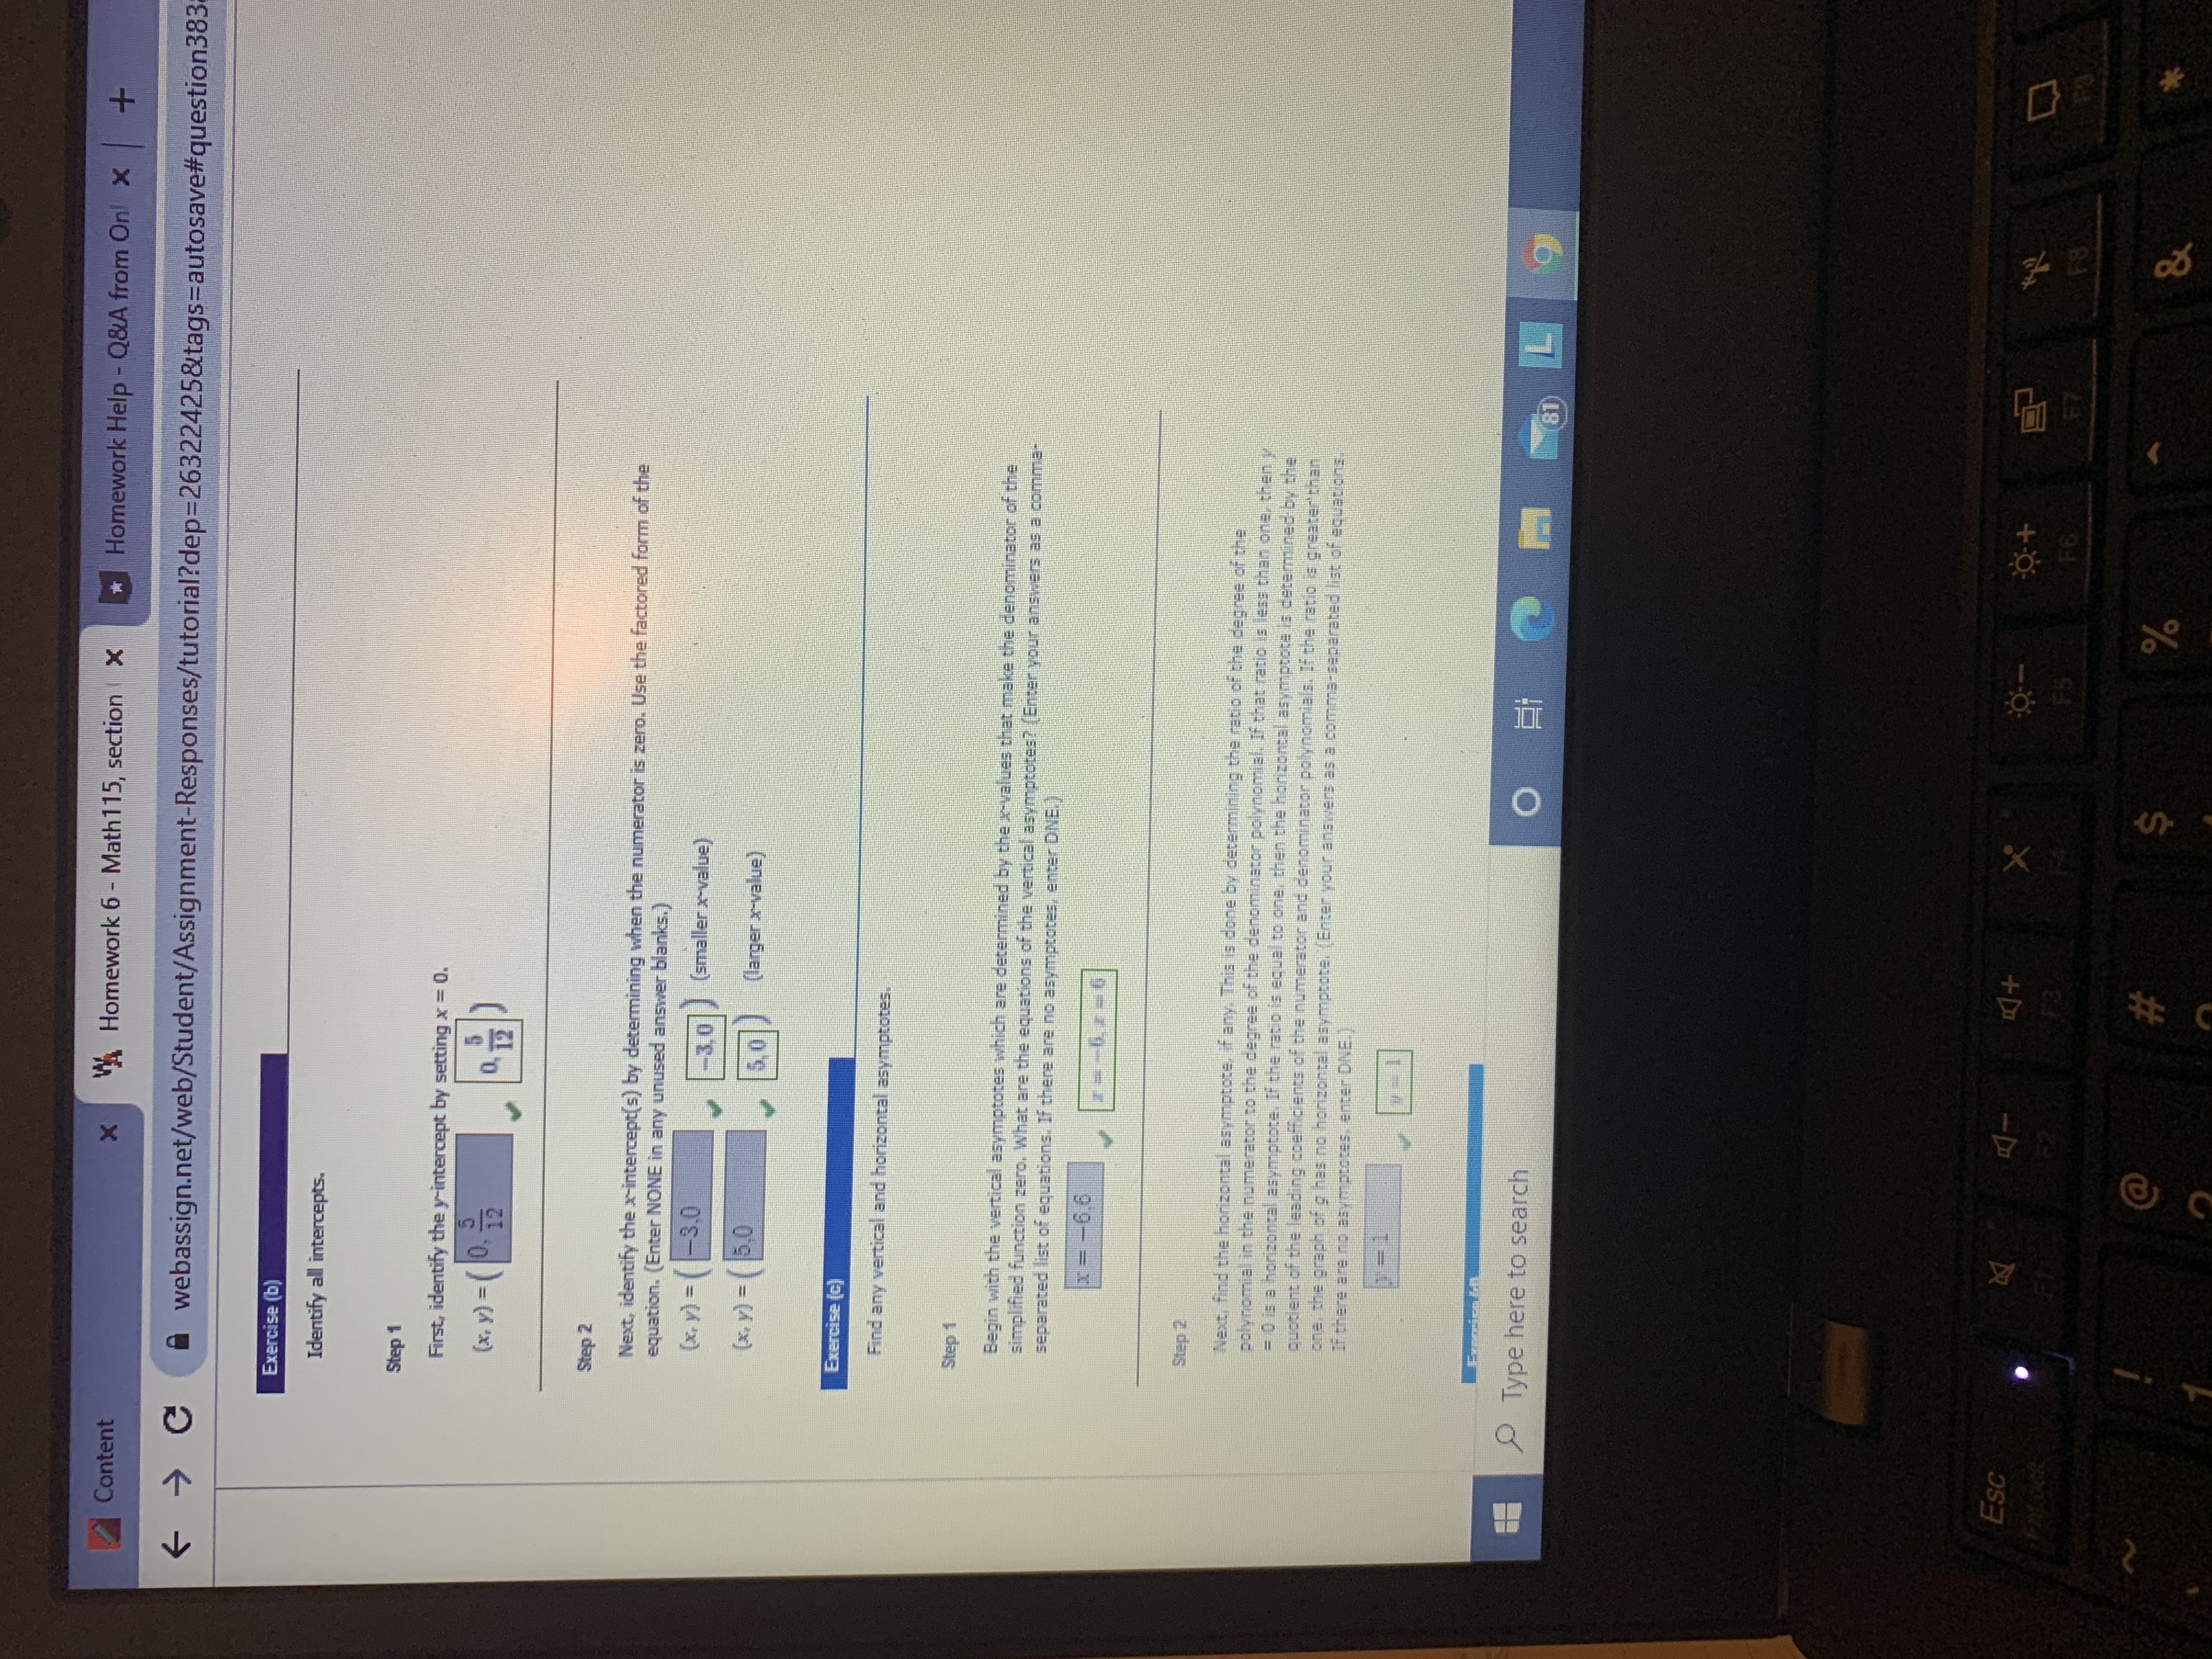
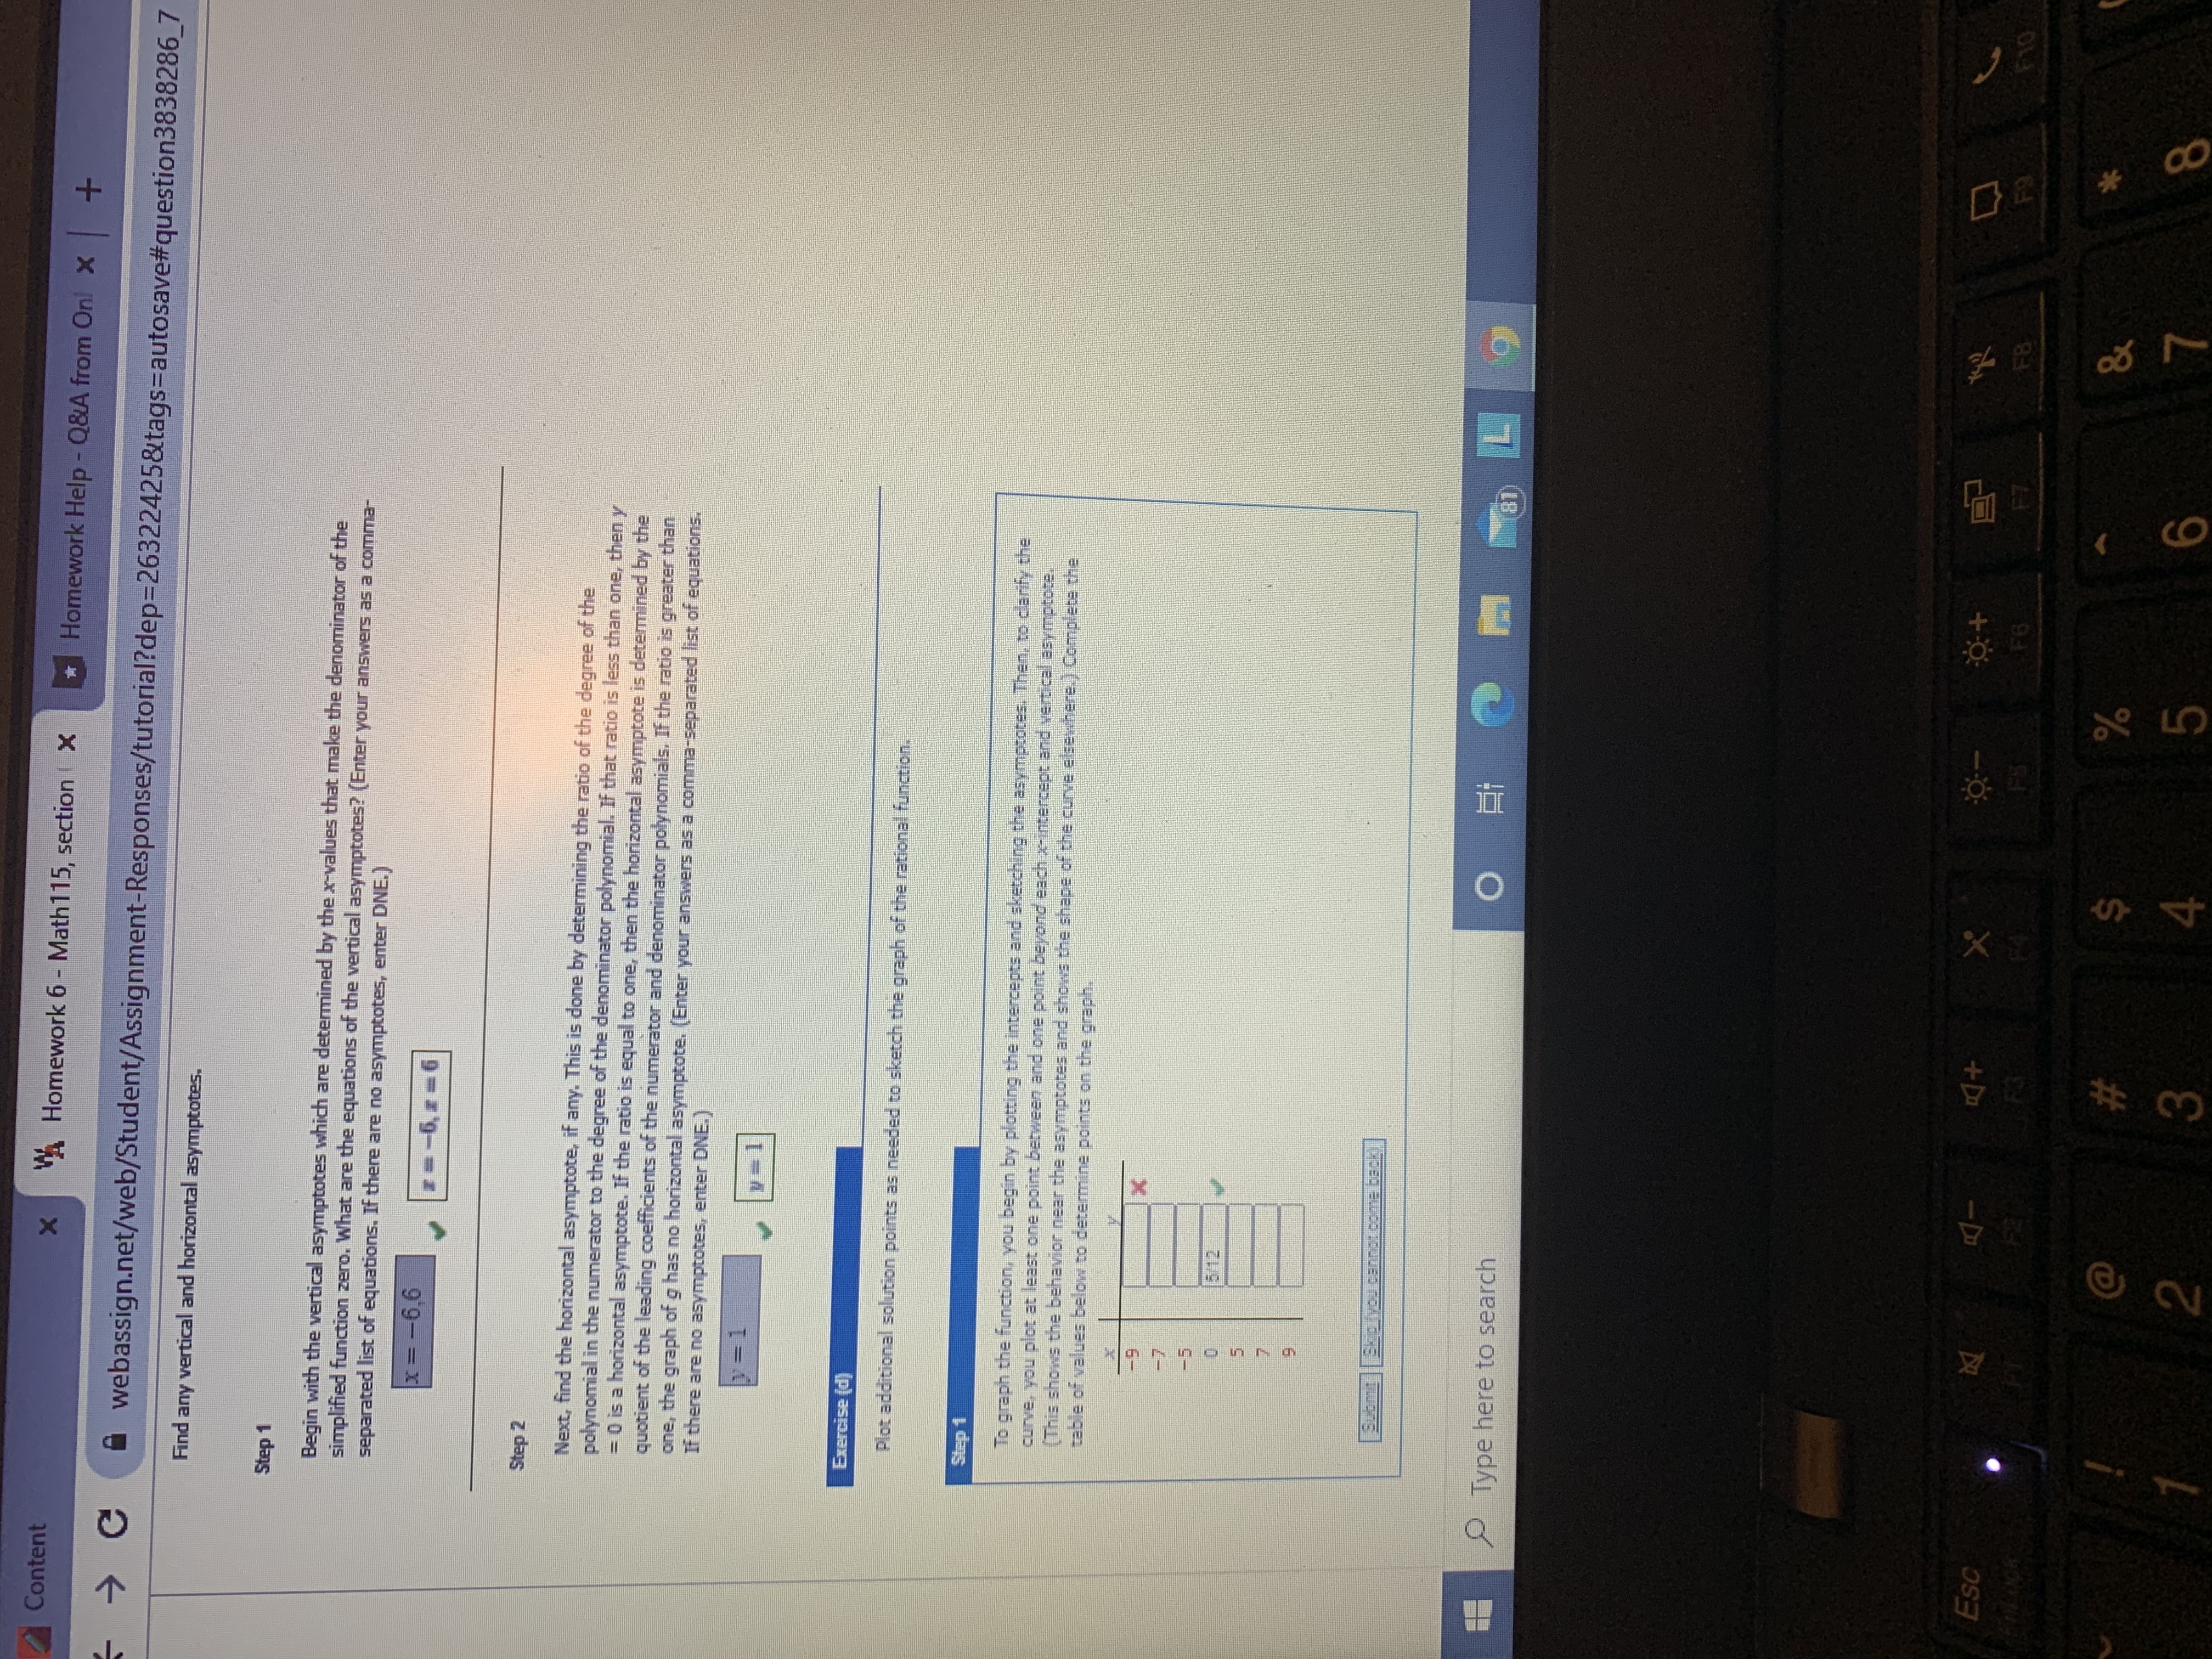
-> C webassign.net/web/Student/Assignment-Responses/tutorial?dep=26322425&tags=autosave#ques Need Help? 8. [12/19 Points] DETAILS PREVIOUS ANSWERS LARAT10 4.2.032.MI.SA. This question has several parts that must be completed sequentially. If you skip a part of the question, you will not receive any points for the skipped part, and Consider the following. g(x) = X - 2x - 15 x2 - 36 Exercise (a) State the domain of the function. Step First, factor the function. 9(x) = 4 - 2x - 15 X2- 36 (x - (6 - 5 ))( x - . 3) ( x - ( B - 6 ) )( - - B - 6 ) Step 2 Since g is a rational function, the domain of g(x) inclue denominator zero. At what value (s) of x is the denomin list.) The denominator is zero when x = 6:- 6 Use your answer to select the correct domain. to all real numbers x except x = -6 all real numbers x except x = 26 all real numbers , except k = 36 all real numbers , except x = 0 I meal numbers or except x = 6 Type here to search O Hi 81) L 9 ESC X @ S & 2 3 4 5 6 7Content X VA Homework 6 - Math115, section ( x * Homework Help - Q&LA from On! x + webassign.net/web/Student/Assignment-Responses/tutorial?dep=26322425&tags=autosave#question383 Exercise (b) Identify all intercepts. Step 1 First, identify the y-intercept by setting x = 0. (x, x) = (0, Step 2 Next, identify the x-intercept(s) by determining when the numerator is zero. Use the factored form of the equation. (Enter NONE in any unused answer blanks.) (x, y ) = ( -3,0 -3,0 (smaller x-value) (x, y) = 5.0 5.0 (larger x-value) Exercise (c) Find any vertical and horizontal asymptotes. Step 1 Begin with the vertical asymptotes which are determined by the a-values that make the denominator of the simplified function zero. What are the equations of the vertical asymptotes? (Enter your answers as a comme- separated list of equations. If there are no asymptotes, enter ONE. x =-6.6 2 --6.1-6 Step 2 Next, find the horizontal asymptote, if any. This is done by determining the ratio of the degree of the polynomial in the numerator to the degree of the denominator polynomial. If that ratio Is less than one, then = 0 is a horizontal asymptote. If the ratio is equal to one, then the horizontal asymptote is determined by the quotient of the leading coefficients of the numerator and denominator polynomials. If the ratio is greaterthan one, the graph of g has no horizontal asymptote. (Enter your answers as a comma-separated list of equations. If there are no asymptotes, enter ONE.) Type here to search O ESC X O-- F8 @ S &Content X A Homework 6 - Math 115, section ( x * Homework Help - Q&A from On! x + webassign.net/web/Student/Assignment-Responses/tutorial?dep=26322425&tags=autosave#question3838286_7 Find any vertical and horizontal asymptotes. Step 1 Begin with the vertical asymptotes which are determined by the x-values that make the denominator of the simplified function zero. What are the equations of the vertical asymptotes? (Enter your answers as a comma separated list of equations. If there are no asymptotes, enter DNE.) x = -6,6 =-5,2-6 Step 2 Next, find the horizontal asymptote, if any. This is done by determining the ratio of the degree of the polynomial in the numerator to the degree of the denominator polynomial. If that ratio is less than one, then y = 0 is a horizontal asymptote. If the ratio is equal to one, then the horizontal asymptote is determined by the quotient of the leading coefficients of the numerator and denominator polynomials. If the ratio is greater than one, the graph of g has no horizontal asymptote. (Enter your answers as a comma-separated list of equations. If there are no asymptotes, enter ONE. y =1 1 = 1 Exercise (d) Plot additional solution points as needed to sketch the graph of the rational function. Step 1 To graph the function, you begin by plotting the intercepts and sketching the asymptotes. Then, to clarify the curve, you plot at least one point between and one point beyond each x-intercept and vertical asymptote. (This shows the behavior near the asymptotes and shows the shape of the curve elsewhere. ) Complete the table of values below to determine points on the graph Suomi Skee /you cannot come back Type here to search O 81 L 9 ESC X F9 F.10 @ S & 2 3 4 5 8